


For the Energy Contribution result, you can filter result data in the Graph and Tabular Data windows and present the data in a mosaic chart highlighting potential elemental energies for each body and every mode shape.
Note: For this result, you must set the On Demand Expansion property (Options) to and the Volume and Energy property (Output Controls) to .
Viewing the Energy Contribution
The mosaic chart displays automatically for this result. Using the display options of the result, you filter the visibility of the top contributing bodies and mode shape/mode shape range. The application plots energy values in the Graph and Tabular Data windows per body (Y Axis) versus the number of modes (Max Modes to Find) specified in the Options category of the Analysis Settings.
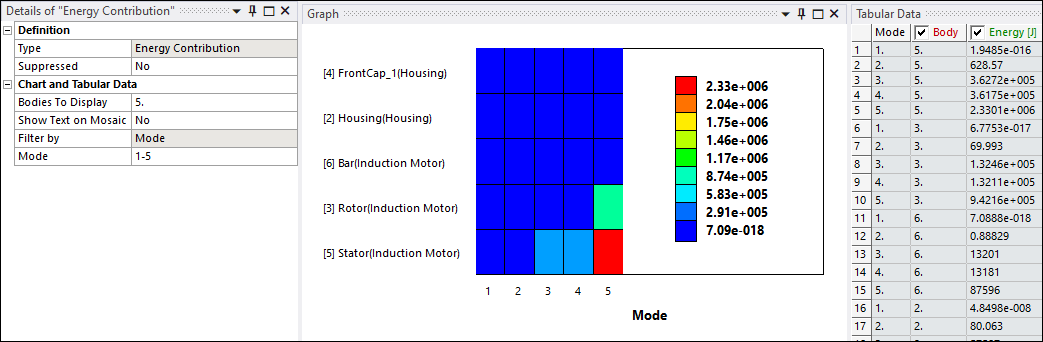
Details pane properties related to the contribution, under the Chart and Tabular Display category, include:
Show Text on Mosaic: Display the result values of each frequency for the panels. Options include (default) and .
Bodies to Display: Select the number of bodies you want to display. The default option is set to . A value other than displays the number of bodies based on your entry. To reset the property to , enter zero (0). The application displays the bodies that have the highest peak value (the maximum value of a row). For the mosaic chart, the bottom row represents the highest values and for the tabular data, the highest values are in the first row or rows.
Mode: This is an entry property to further filter graph and tabular data using a single mode value, multiple mode values, or a range of mode values. The number of available modes is determined by the setting of the Max Modes to Find property in the Analysis Settings. For property entries, you can enter multiple values, separated by a comma (12, 16, 24) as well as range values separated by a hyphen (28-40), or a combination of entries, such as 12, 16, 24, 28-40.