To specify a pressure load with a table:
Create a table of pressure loads. The table's dependent variables must include either of the following:
Pressure: the magnitude of pressure normal to the selected surface.
Pressure_i, Pressure_j, Pressure_k: the X, Y and Z components of a pressure vector.
For instructions on how to create and work with tables, see Create a Table.
Note: Be aware of the following when creating a table of pressure loads:
The dimensions of pressure components must match the dimensions of the model. For a detailed discussion of how to specify pressure components for 2D and 3D analyses, see Tables in 2D and 3D Models .
Temperature can be included as an independent variable but is not used by the solver.
Create a new Pressure boundary condition object.
Select the desired Scoping Method for the boundary condition.
Set Define By to Normal To (the default).
Click the Magnitude field and select the name of the table from the drop-down menu. The menu lists tables that include pressure or pressure components (Pi, Pj, Pk) as dependent variables. For example, in the screen shot below, the Magnitude menu lists the tables P-Table (which contains the magnitude of pressure) and Pijk-Table (which contains pressure components).
If the model does not contain a table of pressure or pressure component values, you can manually create a new table by selecting . Mechanical automatically creates a table with Pressure as the dependent variable and Time as the independent variable. Enter data into the table as described in Manually Enter a Table . The new table is then listed on the drop-down menu and can be assigned to the pressure boundary condition.
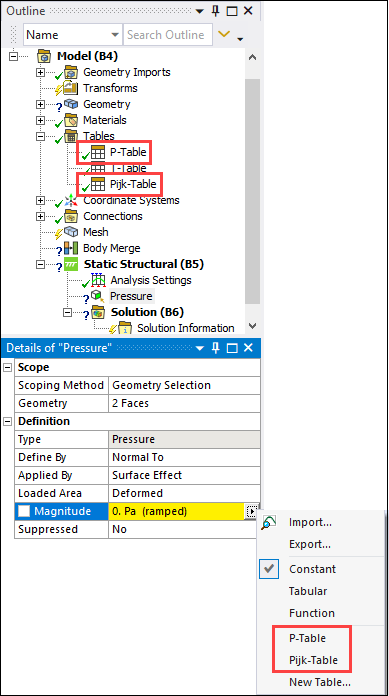
Check the box next to Magnitude to parameterize the table. This allows you to perform design point studies with different tables of pressure data. For details, see Table Parameters and Design Points in the Workbench User's Guide.
If the table contains spatial coordinates (X, Y or Theta, Z) as independent variables, the Spatial Coordinate System shows the coordinate system used by the table. For more information, see the discussion of spatial coordinate systems under View Table Details.
Under Graphics Controls, specify the start time for displaying the load data. This category only displays if the selected table includes time as an independent variable.
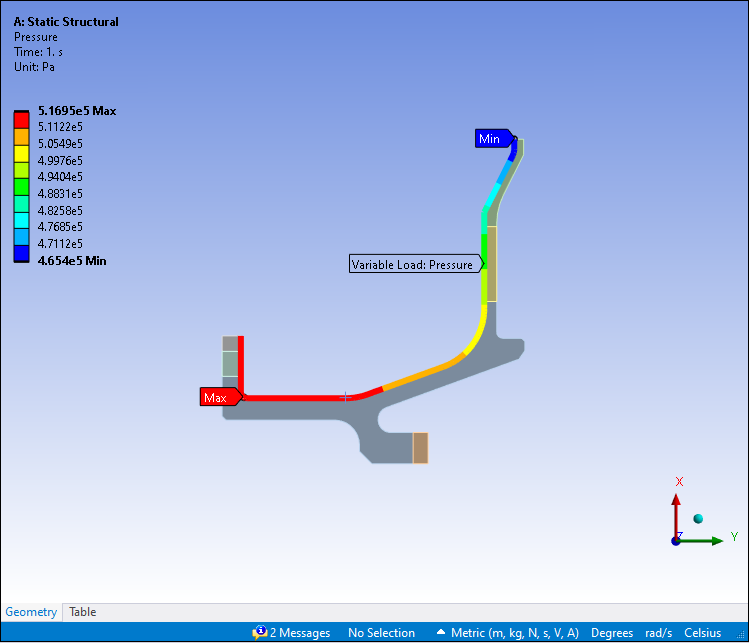
Mechanical plots the pressure values in the table mapped onto the selected geometry. The example below shows a table of pressure values that has been assigned to a surface of a 2D model of a turbine blade. You can view the assigned table in read-only mode by clicking the Table tab. (To edit the table, you will need to select its name under the Tables object.)