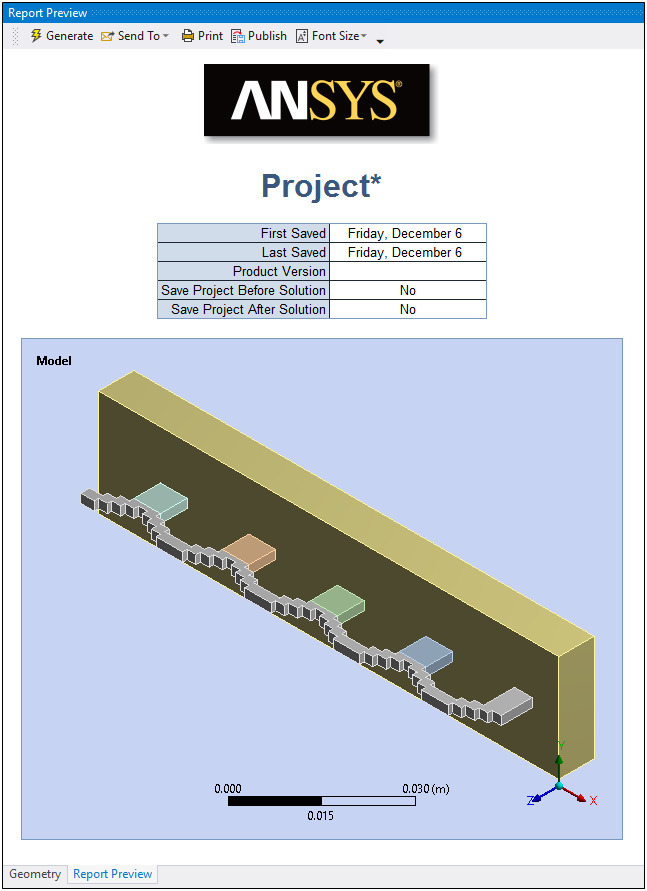
The Report Preview option, selected from the Tools group on the Home tab, enables you to create a report based on the analyses in the Outline. This report selects items in the Outline, examines the worksheets for it, then appends any material data used in the analysis. The report generation process starts immediately, and, once started, it must run to completion before you can begin working in the interface again.

The generation process of the feature starts as soon as you select the option. Unlike prior report generators, this system works by extracting information from the user interface. It first selects each item in the Outline, then examines worksheets in a second pass, and finally appends any material data used in the analysis. The material data will be expressed in the Workbench standard unit system which most closely matches Mechanical's unit system. Once started the report generation process must run to completion. Avoid clicking anywhere else in Workbench during the run because this will stop the report process and may cause an error. This approach to reporting ensures consistency, completeness, and accuracy.
Important: When running multiple Mechanical sessions, the application automatically overwrites any existing files (MHT, HTML, Word, or PPT) if you generate report outputs without first managing them with the Publish feature or by copying files to a new location.
Note: Not all Report Preview options are available on the Linux platform.
Tables
Most tables in the report directly correspond to the Details of an object or set of related objects. Object names appear across the top of the tables.
By default, tables displays 12 columns. This setting increases the likelihood that tables will fit on the screen and on printed pages. In the dialog you can increase or decrease the setting for the number of columns you wish to display by default. For example, you may allow more columns if object names take up little space, if you have a high resolution screen, or print in landscape layout. The minimum is two columns, in which case no grouping of objects occurs and the Contents is equivalent to the Outline.
The system merges identical table cells by default. This reduces clutter and helps to reveal patterns. You can disable this feature in the dialog.
Note: The Report Preview feature does not display table entries from the nonlinear joint stiffness matrix.
Figures and Images
Figures and Images appear in the report as specified in the Outline. The system automatically inserts charts as needed. The system creates all bitmap files in PNG format.
You may change the size of charts and figures in the preference in the default Options settings. For example, you may specify smaller charts due to few data points or bigger figures if you plan to print on large paper. For best print quality, increase the Graphics Resolution in the preference. In addition, you can increase legend font sizes using the Font Magnification Factor option under the Graphics Options preference.


