


As the solution proceeds, you can monitor its progress as follows:
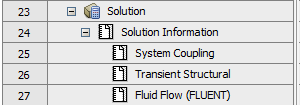
Solution information is automatically generated for output of System Coupling and the coupling participants. Figure 31: Solution Information node shows an example of the Outline of Schematic's Solution Information node. Select one of the solution information sources underneath it to view its output in the Solution Information pane.
Note: The default behavior of the Solution Information pane is to always show the latest information in the Log file. Each time information is added, the file automatically scrolls to the end. However, if you move the vertical scroll bar away from the bottom, the pane will not scroll to the end when information is added until you move the scroll bar back to the end.
There are also some keyboard short-cuts that are available when operating in this pane:
Page Up scrolls up one page.
Page Down scrolls down one page.
Ctrl+Home jumps to the top of the Log.
Ctrl+End jumps to the bottom of the Log.
For details on the solution information shown when you select System Coupling, see Transcript and Log File. For details on the solution information shown for a given coupling participant, use the links in Supported Coupling Participants for System Coupling in Workbench to access its product documentation.
Note: When Beta Options are enabled in Ansys Workbench, you can also select your own text files to monitor in the Solution Information pane. To do this, right-click the Solution Information entry in the Outline pane, choose Create Solution Information (Beta) and select the desired file.
The System Coupling Chart Monitor displays the coupling chart selected in the System Coupling tab's Outline of Schematic. System Coupling charts plot the data produced by System Coupling during its execution. They are updated dynamically during the analysis, so you can use them to monitor convergence as the solution progresses.
Note: Currently, System Coupling in Workbench does not plot participant quantities. However, charting of participant quantities is available in System Coupling's interfaces. For more information, see Reviewing Convergence Diagnostics Charting Output.
For information on monitoring fluid participant quantities in a CFD participant product, see one of the following sections
In the Outline of Schematic, you can use the context options for the Chart Monitors node to create multiple charts, and then use the context options for the individual Chart nodes to select the variables to be plotted.
For information on working with the charts generated by System Coupling in Workbench, see:
Multiple levels of X-axis data are available for plotting. The higher (coarser) levels of data are called parent levels, and the lower (finer) levels of data are called child levels. Any data present in a child level is also available to its parent level. For example, Figure 32: Hierarchical availability of plotting data shows a flowchart illustrating the availability of plotting data for an sample coupled analysis run.
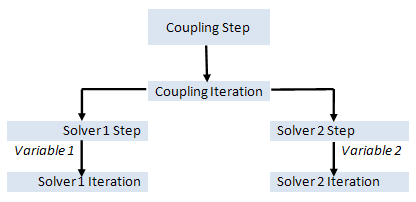
In this coupling run:
Coupling Step is the parent level for
Coupling Iteration, which is the parent level for
Solver 1 Step and Solver 1 Iteration, and
Solver 2 Step and Solver 2 Iteration.
The two variables, Variable 1 and Variable 2, with each being available for plotting at their respective solver iterations and, by extension, all of the iteration's parent levels:
Variable 1 is available at the Solver 1 Iteration level, so is also available at parent levels Solver 1 Step, Coupling Iteration, Coupling Step.
Variable 2 is available at the Solver 2 Iteration level, so is also available at parent levels Solver 2 Step, Coupling Iteration, Coupling Step.
When a Chart object is selected in the System Coupling tab's Outline of Schematic, its properties are shown in Properties of Convergence Chart:
- Axis X
Contains the following property:
- Quantity
Level at which the X data for the variables is plotted. Possible values, which are determined by the type of analysis being performed, are:
Coupling Step
Coupling Iteration
Coupling Time (transient analyses only)
- Axis Y
Contains the following property:
- Title
Title of the Y axis for the chart.
- Axis X, Axis Y
Properties supported for both axes:
- Scale
Scale of the axis.
Possible values:
Linear Common
Log (Log base 10)
Natural Log
- Automatic Range
Defines whether automatic scaling or range maximum and minimum are applied to the axis.
When selected, automatic scaling is used.
When not selected, the range specified by the range minimum and maximum properties is used.
- Range Minimum
Available when the Automatic Range property is not selected. Minimum of the range of values for the axis.
- Range Maximum
Available when the Automatic Range property is not selected. Maximum of the range of values for the axis.
The System Coupling Chart Monitor plots data produced during the coupled solution process. It can plot the following variables:
the RMS change in data transfer values
diagnostic values (sum and weighted average) taken from the nodal data associated with data transfers
For more information on System Coupling chart variables, see:
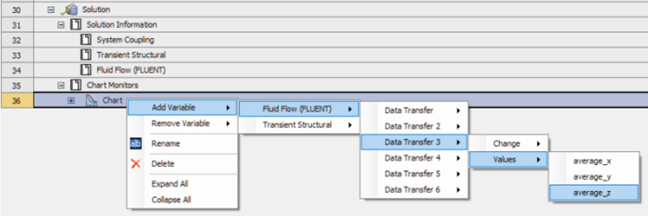
You can add a variable to a chart by using its Chart node's Add Variable context option. Variables are organized by coupling participant and data transfer, as shown in Figure 33: Selection of Convergence Chart variable.
The variables to be plotted for a chart are listed under its Chart node in the Outline of Schematic. When a chart variable is selected, its properties are shown in Properties of Chart Variable.
- Refinement Level
Specifies the level refinement for X axis variable data. Variable data plotted at the X axis level can be further refined to any of the X axis' child levels. For example, if the X axis Quantity is defined at the Coupling Step level, then the X data values for its variables can be refined to the Coupling Iteration level.
In this case, the intermediate values available at the coupling iteration level between consecutive coupling steps are distributed equally between the coupling steps — that is, if coupling step 2 has three coupling iterations, then the data points are plotted at 1.33, 1.66, and 2.
- Style
Contains the following properties that define the appearance of the chart:
- Color
Defines the line color of the chart variable in a plot.
- Line Width
Defines the width (in pixels) of the line for this chart variable.
- Symbol Size
Defines the size of a symbol in (pixels) when a symbol is drawn for this variable.
Context options are available for working with System Coupling charts. In the System Coupling tab's Outline of Schematic, you can access these options by right-clicking the Chart Monitor node or any chart or chart variable nodes defined underneath it.
- Create Chart
Available for the Chart Monitors node.
Creates a new System Coupling chart without any variables defined. By default, the new chart's X axis Quantity is set to the Coupling Iteration level.
- Add Variable
Available for the Chart nodes.
Variables can be added to a chart after the solution has started or completed. Right-click an existing chart, select Add Variable, and then select the variable to be added.
By default, the new variable's Refinement Level is set to the same level as the X axis Quantity property. If data for the new variable is not available at that level, then the X axis Quantity property and the variable's Refinement Level properties are both set to Coupling Iteration.
- Remove Variable
Available for the Chart nodes.
Right-click an existing chart, select Remove Variable, and then select the variable to be removed.
- Delete
Available for the Chart and chart variable nodes. Deletes the selected item from the chart.
- Rename
Available for the Chart and chart variable nodes. Allows you to rename the selected item.
Note: When the solution is started, a default chart is added if one is not already present. The default variables added correspond to the RMS change in data on the target side of all data transfers. For example:
If Data Transfer and Data Transfer 2 are defined with target participants equal to Transient Structural and Fluid Flow, respectively, then the chart variables Transient Structural: Data Transfer: Change: RMS and Fluid Flow: Data Transfer 2: Change: RMS are added to the default chart.
If you add/delete variables to the default chart, then new variables are not added by default on consecutive runs.
You can manipulate the display of a chart using the Zoom, Pan, and Fit operations:
Zoom by using the mouse wheel or Shift+middle mouse button
Box zoom by using the right mouse button
Pan by using Ctrl+middle mouse button
Fit by using the F key.
To save a System Coupling chart as a graphic:
Right-click the background of the chart and select Save Image As.
A dialog that displays, showing a small image of the chart.
Select the Size (resolution) to be used when saving the chart.
Click the ellipsis (
 ) and navigate to the folder where you want to save the file.
Enter a filename.
Select a graphic file type (.png or .bmp).
Click Save and then click OK to save the file to the location and at the resolution you have selected.
Note: When Quantity is set to Coupling Time, the first data point may be generated at 0 instead of the time the first coupling step finishes. The second and all subsequent data points are then generated at the correct times, according to the Time Step Size defined.