


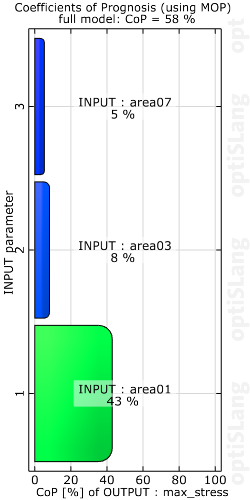
This plots shows the Coefficient of Prognosis (CoP) of the input parameters. If an input parameter is selected using the CoP Matrix or the respective dimension selection controls in the Common settings pane, the bar chart plot displays the CoP of this parameter for all output parameters. The CoP for the full model with all input parameters is listed in brackets behind the actual CoP value. Accordingly, if an output parameter is selected, the bar chart plot displays the CoP's of all parameters for this output parameter. The CoP of the full model (all input parameter terms) is written in the second title line. The information about the underlying model is written in the plot title.
If the MOP option Testing type is set to value Leave one out, see Predictive Coefficient of Determination
Settings
| Option | Description |
|---|---|
| Common Settings | |
| Show interactions | Toggles the view to show or hide interactions. |
| Common Preferences | |
|
The following preference settings are available:
For more details, see Plot Preference Settings. | |
| Plot-Specific Preferences | |
| Filter value lower than [%] | Sets the value where if the coefficient value is below this number, data is filtered from the chart. The default value of 0.0 means no filtering. |
Python scripting
Create Visual
Creates a Coefficient of Prognosis plot using data with data_id
cop = Visuals.CoP(Id("Coefficient of Prognosis"), data_id)
Add to Postprocessing
Adds Coefficient of Prognosis plot in postprocessing to control_container, using the specified relative positioning.
    control_container.add_control (
        cop,
        True,
        RELATIVE_POSITIONING,
        0, 70/100., 1/2., 30/100.
    )