


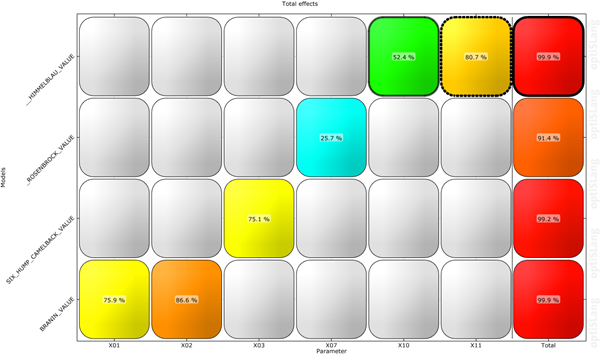
This plot provides an overview of the MOP results. The full model CoPs for every output parameter are shown in the last column. The single CoP values of the input parameters are shown line-by-line. Using the CoP matrix, the most important input parameters can be determined and the forecast qualities of the identified surrogate models can be evaluated. As a result, the CoP matrix helps to find a decision whether to use this model for optimization or to improve it by additional sampling data or further inputs. A selection causes an interaction (a changing of the parameter selection) in the remaining postprocessing.
With the Show extended setting the extended view can be activated. Now the last column contains also the name of the found model if enough space is available. Additionally, the support points used to generate the surrogate models and an approximation plot are shown for each parameter/response combination which is not filtered. The approximation plot uses the globally defined parameter values which can be edited using the Parameter Settings widget.
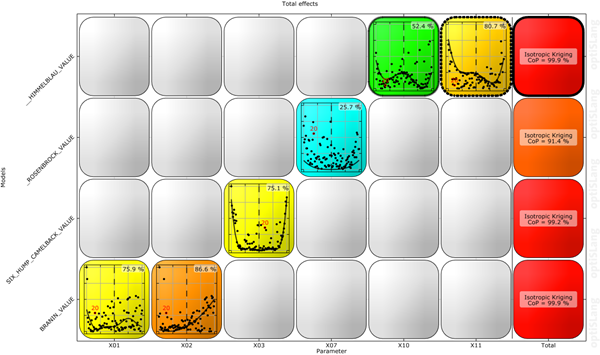
In extended mode, if you hold the mouse cursor on one tile with content, then the tile becomes activated, signaled by a red border When active, you can select designs. When you double-click one tile with content, the plot zooms so that tile fills the plot, and the tile becomes instantly active for design interaction.
Settings
| Option | Description |
|---|---|
| Common Settings | |
| Show indices | Toggle single CoP values to show coupled terms as , or . |
| Show extended | Displays response surface 2D plots in tiles in a parameter range where they are not filtered. Also displays model information text in Total column (if the tiles are big enough to show content, the tile is shown with round corners instead of a pure rectangle). |
| Common Preferences | |
|
The following preference settings are available:
For more details, see Plot Preference Settings. | |
| Plot-Specific Preferences | |
| Filter value lower than [%] | Sets the value where if the coefficient value is below this number, data is filtered from the chart. The default value of 0.0 means no filtering. |
| Filter models with total value lower than [%] | Removes every row from the matrix where the model CoP is lower than the given value. The default value of 0.0 means no filtering. |
| Show filtered | Displays the content of all CoP tiles, even the ones that the MOP has filtered out. These tiles were initially empty. |
| Object text orientation | Orientation of text displayed in the tile can be toggled from , which means text takes vertical orientation if horizontal space is not enough, to strictly or . |
| Approximation line width scale | Set the line width scale of the approximation line. Line is drawn with a width of the Line width property and this scale. To make the approximation line thicker without changing all the other lines. Setting is only visible when Show extended is enabled. |
| Show background cop | Show or hide the tile color. |
| Show cop | Show or hide CoP values as text. |
| Show round corners | Show or hide round corners on the tiles. When hidden, tile content has a little more space. |
| Show approximation line | Show or hide approximation line. Setting is only visible when Show extended is enabled. |
| Approximation resolution | Change the resolution the approximation line is drawn with. Settings is only visible when Show extended and Show approximation line are enabled. |
| Show support points | Show or hide support points used to create the model. Setting is only visible when Show extended is enabled. |
| Show deactivated support points | Show or hide support points used to create model that were then deactivated. Setting is only visible when Show extended is enabled and when support points are deactivated. |
| Show additional points | Show or hide additional points. Setting is only visible when Show extended is enabled and when additional points exist. Additional points are created when there are points not used for the model to build up. |
| Show approximated points | Show or hide approximated points. Setting is only visible when Show extended is enabled and when approximated points exist. Approximated points are created with the Approximation Design Table. |
| Show parameter line | Show or hide the parameter line. The vertical line displays the position of a globally defined parameter value. Setting is only visible when Show extended is enabled. |
| Show grid | Show or hide a default grid in tiles. Setting is only visible when Show extended is enabled. |
| Show selection | Show or hide the selected model and its two major parameters as a thicker line around the tile. |
Python scripting
Create Visual
Creates a CoP matrix using data with data_id
cop_matrix = Visuals.CoPMatrix(Id("CoP Matrix"), data_id)
Add to Postprocessing
Adds CoP matrix in postprocessing to control_container, using the specified relative positioning.
    control_container.add_control (
        cop_matrix,
        True,
        RELATIVE_POSITIONING,
        0, 70/100., 1/2., 30/100.
    )