


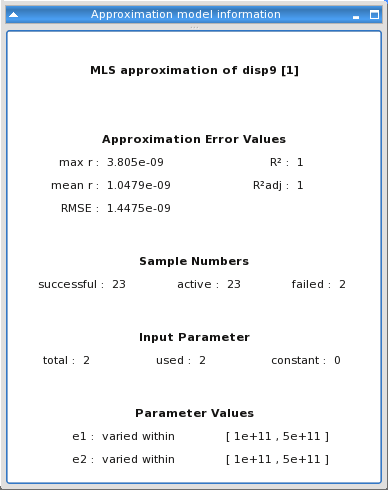
This plot lists some approximation model information. First there are the approximation errors of the at present selected response parameter. If a certain support is selected, the residual at this point is also shown. Also listed is some information about the support point set the numbers and values of the input parameters.
Preferences
The following preference settings are available:
Window appearance
Font size
For more details, see Plot Preference Settings.
Python scripting
Create Visual
Creates an Approximation Model Information plot using data with data_id
    approx_info = Visuals.ApproxModelInfo(
        Id("Approx Model Info"),
        data_id
    )
Add to Postprocessing
Adds Approximation model Information plot in postprocessing to control_container, using the specified relative positioning.
    control_container.add_control (
        approx_info,
        True,
        RELATIVE_POSITIONING,
        1/2., 0, 1/2., 1/2.
    )