


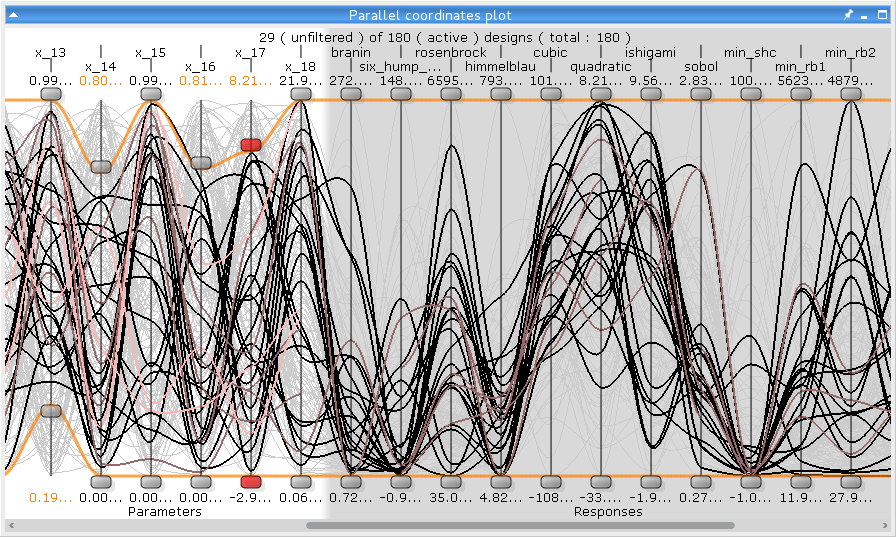
This plot shows all parameters (input, output, objectives and constraints) for all designs. The failed designs are pink, the deactivated designs are grey, incomplete designs are violet, and the selected designs are red. Each parameter has two sliders to define a lower and an upper bound. Designs outside these bounds are also colored grey. You can select designs in the Common settings pane. You can hide certain parameters or change their displayed order using the context menu.
Context Menu
| Option | Description |
|---|---|
| Appearance | Displays the Appearance menu. |
| Magnifying Glass | Magnifies part of the plot. |
| Deactivate | Deactivates selected designs. |
| Activate All | Activates all designs. |
| Dimension Modifications | Displays the Dimension Modifications menu. |
| Cluster Analysis | Displays the Cluster Dialog. |
| Export | Displays the Export menu. |
Appearance Menu
| Option | Description |
|---|---|
| Font size | Changes font size to predefined values. |
| Disable/Enable Beziers | Activates or deactivates beziers. |
| Line Anti-aliasing | Change aliasing of lines. |
| Change Color | Changes the color of filtered or unfiltered designs and reverts the color change. |
Dimensions Modifications Menu
| Option | Description |
|---|---|
| Activate/Deactivate Dimensions | Opens the Dimension dialog. |
| Deactivate selected Dimensions | Activates or deactivates all or selected dimensions. |
| Activate all Dimensions | |
| Activate Dimension Dragging | Changes the displayed order of the dimensions. |
| Restore original Dimension Order | |
| Fit on Selection | Moves sliders to selected or unfiltered designs limits. |
| Fit on Unfiltered |
Export Menu
| Option | Description |
|---|---|
| Picture | Saves the plot image to a file. |
| Dimension Limits | Saves the dimension limits to a file. |
| Parameter | Saves the parameters to a file. |
Preferences
The following preference settings are available:
Appearance
Font size
Line width
Symbol size
Window appearance
For more details, see Plot Preference Settings.
Python Scripting
Create Visual
Creates a parallel coordinates plot using data with data_id.
pcp = Visuals.DesignTable(Id("Parallel coordinates plot"), data_id)
Add to Postprocessing
Adds parallel coordinates plot in postprocessing to control_container, using the specified relative positioning.
    control_container.add_control (
        pcp,
        True,
        RELATIVE_POSITIONING,
        0., 0., 1., 1./2.
    )