


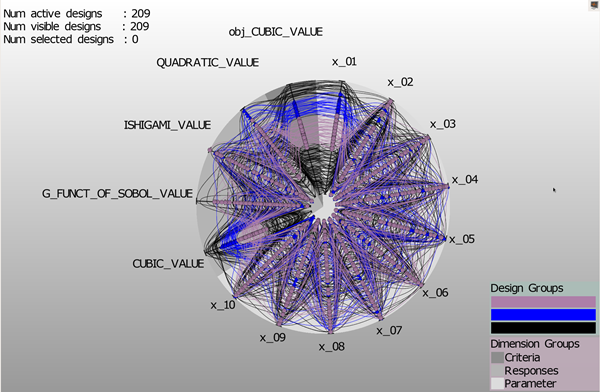
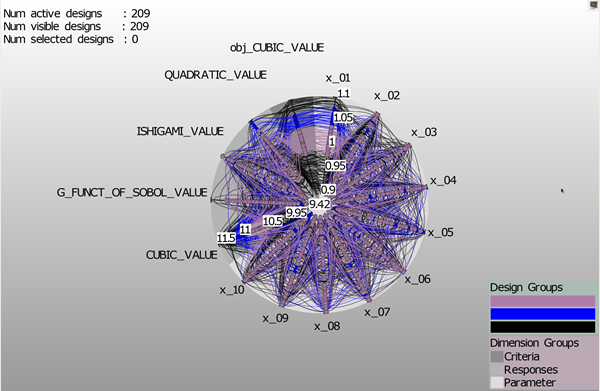
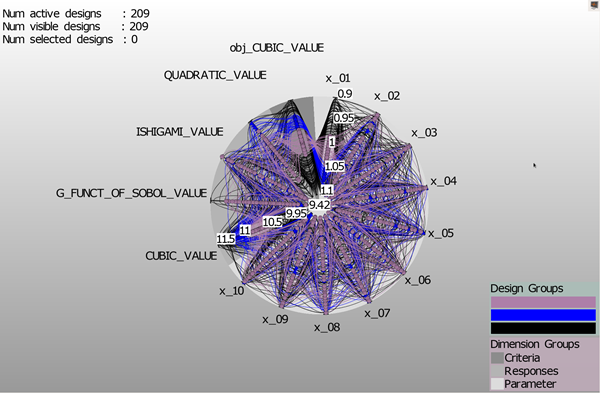
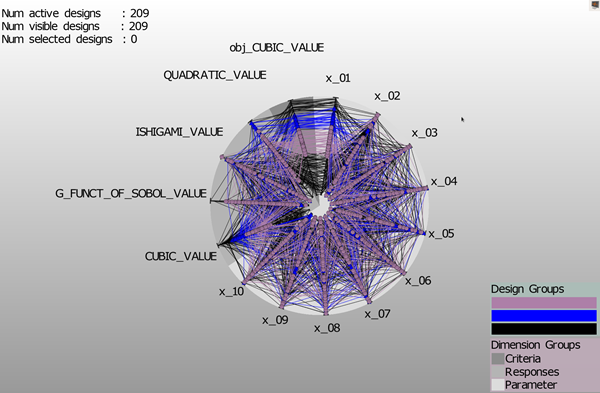
This plot is a two-dimensional chart for displaying multi-variable data of three or more quantitative dimensions.
Controls
| Control | Description |
|---|---|
| Left mouse button | Select single design |
| Ctrl + Left mouse button | Add single design to selection |
| Hold Ctrl + Left mouse button while dragging | Select multiple designs |
| Hold Shift + Left mouse button while dragging | Move the plot |
| Mouse wheel | Rotate the plot |
| Hold Ctrl Ctrl + Mouse wheel | Zoom the plot in/out |
Highlighting
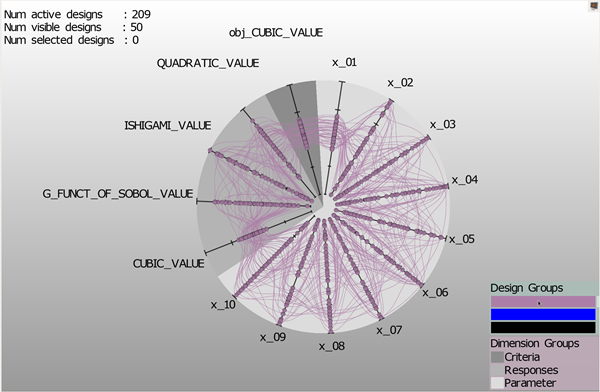
To highlight a group of designs, hover over the corresponding entry in the legend. The highlighting shows only the hovered group of designs.
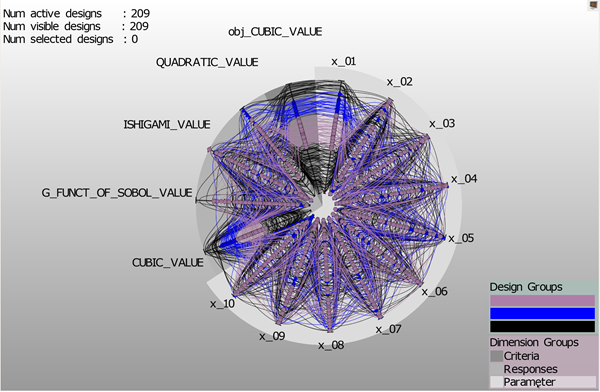
To highlight a group of dimensions, hover over the corresponding entry in the legend. The highlighting increases the radius for the rendered area of the corresponding segment of the circle.
Context Menu
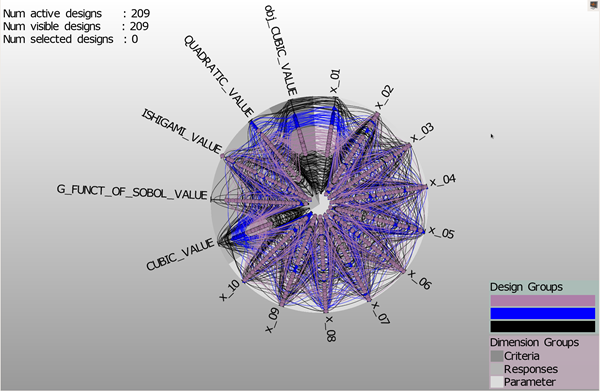
Rotate Dimension Names
Dimension names can be horizontally aligned or rotated with the plots dimension axes.
Invert Axis Scale
Each axis scale is individually invertible.
>
The designs can be rendered as splines (default) or lines.
Preferences
The following preference settings are available:
Appearance
Font size
Line width
Symbol size
Window appearance
For more details, see Plot Preference Settings.