


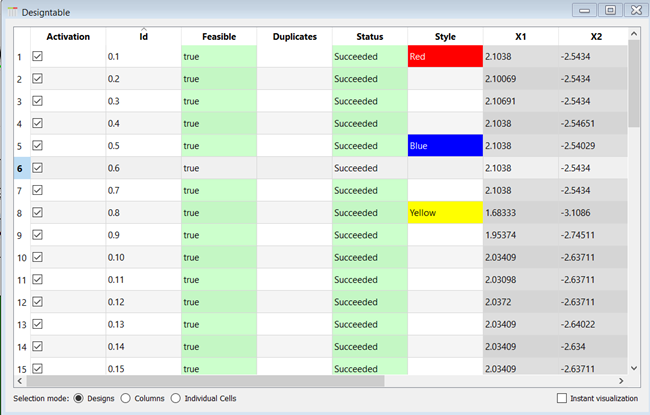
This table contains the numerical data and status information of all visualized designs of the current postprocessing. Additional style information is also provided. Select or deselect a design by clicking the table row. To activate or deactivate the design, select or clear the check box in the Activation cell. You can also activate/deactivate and style the design using the context menu. To sort the table columns, click the column headers.
You can select the following options below the design table.
Selection mode: Set how you select information in the design table.
(select a row)
Instant visualization: Displays visual information of the selected values. A graphical and a textual representation is available by switching the tab of the visualization widget. Multiple values can be visualized simultaneously.
Settings
| Option | Description |
|---|---|
| Common Settings | |
| Show deactivated designs | When selected, shows previously deactivated designs. When cleared, only activated designs are displayed. |
| Preferences | |
|
The following preference settings are available:
For more details, see Plot Preference Settings. | |
Python Scripting
Create Visual
Creates a design table using data with data_id.
design_table = Visuals.DesignTable(Id("Design table"), data_id)
Add to Postprocessing
Adds design table in postprocessing to control_container, using the specified relative positioning.
    control_container.add_control (
        design_table,
        True,
        RELATIVE_POSITIONING,
        0., 0., 1., 1./2.
    )