


The Extraction Tool Kit (ETK) interface combines the full functionality of all separate ETK/output interfaces for the following file formats:
This node is able to handle solver responses provided in binary and text form.
Opening the Reference File
You can browse for a file or select a registered file.
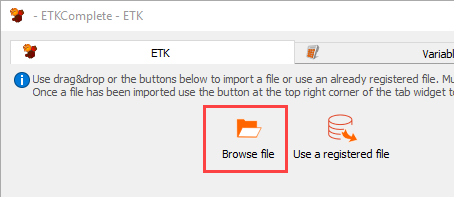
To browse for a file:
On the ETK tab, click Browse file.
In the Choose a file to open dialog, browse to and select the reference file.
Click .
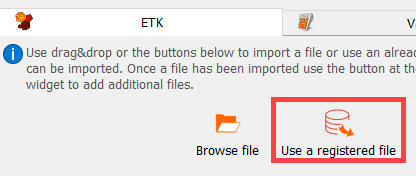
To use a registered file:
Click Use a registered file.
In the table, select the reference file.
Click .
After importing the file, the pane below is filled with data depending on the file format.
Defining Responses
You can define responses in multiple ways, including direct definition of matrices or signals.
Directly
Highlight the response and then drag and drop it into the Responses or Output slots pane.
Using Markers
In the text field, highlight the required string.
Right-click and select one of the following options from the context menu:
>
Use a text marker to define a scalar response.
>
Use a text marker to define a vector response. Each occurrence of this marker in the file or until the end marker is reached is used.
In the Variable Name field, enter a name for the variable.
From the multi-action button, select either or .
Using Locations
In the text field, highlight the required response value.
If a marker has not been defined, right-click and select > from the context menu.
The file is read from the start and lines or token offset are used to define the response.
If a marker has already been defined, right-click and select one of the following options from the context menu:
>
Start reading from an earlier defined marker and use line or token offset.
>
Start reading from an earlier defined marker and use line or token offset to define a vector.
In the Variable Name field, enter a name for the variable.
From the multi-action button, select either or .
Variables Tab
This tab is used for internal variables. This can be helpful when defining derived outputs, for example, a signal created from two vectors.
Instant Visualization
When selected, visualizes signals and XY-data. A graphical and a textual representation is available by switching the tab of the visualization widget. Multiple values can be visualized simultaneously.
Advanced Options
To access the options shown in the following table, in the Text Output tab, click .
| Option | Description |
|---|---|
| When is selected: | |
| Line |
|
| Token |
|
| Use text marker | When selected, the following options are available:
|
| When is selected: | |
| Line |
|
| Column |
|
| Use text marker | When selected, the following options are available:
|
Run Options
This node has general Run Options. The number of supported options is individual for each node.