


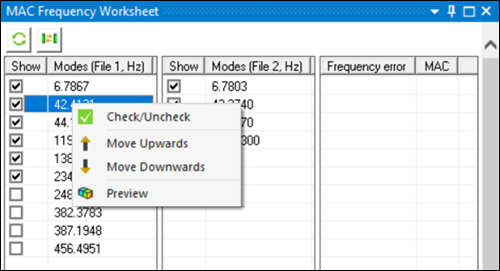
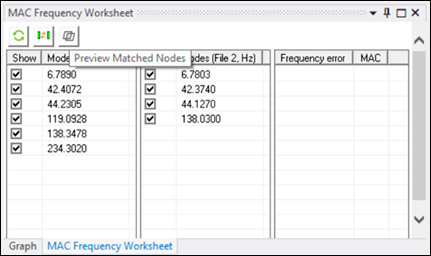
The first two tables of the MAC Frequency Worksheet are populated with the File 1 and File 2 modes when File 2 is set. They offer a preview of the available modes in each file. By clicking the right mouse button after selecting some modes, the following options are available:
- Check/Uncheck
If the mode is checked/unchecked, it gets unchecked/checked. This means that this particular mode is employed/not employed in the subsequent MAC calculations. This option is also triggered for individual modes if its check box is ticked/unticked.
- Move Upwards
The selected modes are moved upwards by one row.
- Move Downwards
The selected modes are moved downwards by one row.
- Preview
The selected mode is displayed in the Mode Animation View.
The and options are especially useful for mode shifts situations in which two different modes can have very similar frequencies.
The changes that are done in the MAC Frequency Worksheet are instantly translated to the 2D MAC Table.
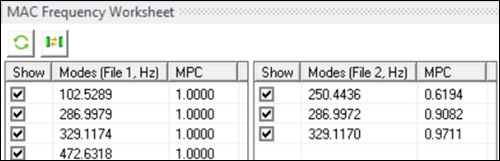
After generating data, the Modal Phase Collinearity (MPC) parameter is added for complex modes.
If you press the button, all modes are ticked and shown in the original order (from lower frequency to higher frequency).
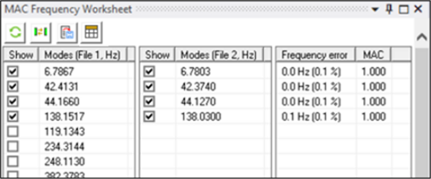
The third table of the MAC Frequency Worksheet shows the results of the automatic mode pairing algorithm. This algorithm is triggered by either pressing the button at the top of the worksheet, or by setting the Pair Modes property in the Details View to . When you press the button, the modes are reordered and paired, and the third table shows the frequency error (absolute and relative) and the MAC values of those mode combinations.
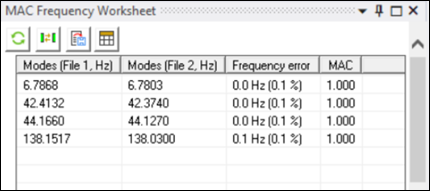
When the modes are paired, two buttons appear at the top of the worksheet that allow you to export the paired modes results to a CSV file and to visualize the combined mode-pair table.
The option is available as the third button at the top of the worksheet. It is only visible if the Data Interpolation property is set to (Matching Node algorithm), data from File 1 and File 2 is available, but MAC Calculator data has not been generated.
This option allows you to try different configurations of File 1 and File 2 and check if the node matching is as expected. This data is plotted in the COMAC Table.
When the option is available, every time you change any File 2 Options or Data Interpolation properties, the data plotted is cleaned.