


The COMAC table is produced when a new successful MAC calculation has taken place or when the option from the MAC Frequency Worksheet is generated. It is shown at the same location as the 2D MAC Table.
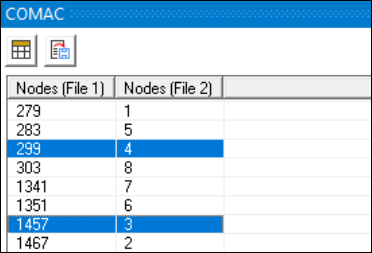
For the algorithm option (Data Interpolation property set to ) it displays the list of nodes that have been matched between File 1 and File 2. The selected nodes in the table are highlighted in magenta (File 1 Node) and green (File 2 Node) in the Geometry pane.
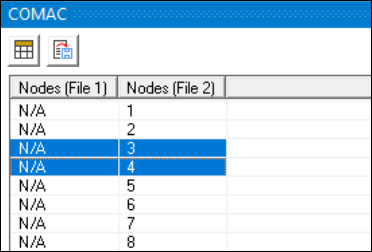
For the algorithm option
(Data Interpolation property set to )
it displays the list of nodes from File 2, and N/A for all the
corresponding nodes of File 1. This happens because the algorithm calculates the node2-equivalent result from the
contribution of all the nodes in File 1, based on their proximity. The selected nodes
in the table are highlighted in green (File 2 Node) in the
Geometry pane.
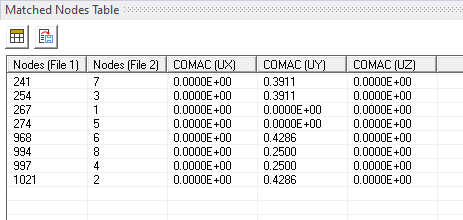
You can also use the COMAC table to compute and display COMAC results. Trigger the calculation by clicking the button above the table. To produce a successful set of COMAC results, the same number of modes must be ticked in the MAC Frequency Worksheet (by either having previously run the Mode Pairing Algorithm or by manually ticking the modes). Calculating the COMAC results supplements the table with COMAC columns.
Finally, the information displayed in the COMAC table can be exported to a CSV file when the button is pressed.