Use the Analysis tab to analyze the results of the simulation. For more information about analysis, refer to Postprocessing (Analysis Tab).
In addition to the Common Ribbon Elements, the Analysis ribbon contains tools that enable you view and evaluate simulation results. Selecting the Analysis ribbon also displays the Deformation Task Panel.

- Formability Tools
- FLD
Display a forming limit diagram (FLD) based on analysis data and the material properties of the blank, and open the FLD Task Panel, where you can choose options for the FLD. The FLD displays where flaws such as cracks, severe thinning, inadequate stretching, and wrinkling are likely to occur in the final product.
- Thinning
Display a plot of thinning in the blank based on analysis data and open the Thinning Task Panel. The plot can display total thinning, current operation thinning, or thickness during each operation of the forming process.
- Edge Stretch
Display a plot of edge stretching based on analysis data, and open the Edge Stretch Task Panel. The plot enables you to view where stretching will occur during the forming process, with reference to the initial state of the blank or to any step of the process.
- Springback
View calculated springback data or measure springback data by comparing the simulated part shape to a reference shape. The Springback Evaluation Task Panel enables you to choose the data to display and configure display options.
- Contact Info.
Display a contour plot of contact information in the graphics window and choose options in the Contact Result Task Panel.
- Surface Quality Tools
- Stoning
Open the Stoning Task Panel and perform a virtual stoning of the workpiece to identify surface defects.
- CircleGrid
Open the Circle Grid Task Panel, choose options for the Circle Grid plot, and display a circle grid plot based on analysis data and your choices.
- Skidmark
Open the Skidmark Task Panel, choose options for a Skidmark plot, and generate a Skidmark plot based on analysis data.
- Curvature
Open the Curvature Task Panel, choose options for the plot of Curvature change, and generate a bending moment change plot based on analysis data.
- In-Flow Tools
- Draw-In
Display a plot of blank draw-in based on analysis data and open the Edge Draw-In Task Panel.
- Material Line
Open the Material Line Task Panel, choose options for a material Line plot, and display a Material Line plot based on analysis data.
- Force Tools
- Tonnage
Open the Tonnage Task Panel, choose operations, and plot tonnage predictions versus time for those operations.
- Advanced Tools
- Contour
Display a contour plot of analysis data in the graphics window and choose options in the Contour Task Panel.
- Vector
Display a vector plot of analysis data in the graphics window and choose options in the Vector Task Panel.
The following task panels are common interface elements to two or more Analysis Tab task panels. The exact set of controls available on these panels will vary depending on the panel from which you access them.
This task panel enables you to define regions of the geometry or select individual points by inputting node IDs to display analysis data values for the chosen region or point. While this task panel is displayed, you may also click in the graphics window to select individual points.
Click the button to remove all data displays and deselect all points and regions. Click the button to return to the task panel from which you opened the List Value task panel.
Use this panel to modify the settings of the contour display in the graphics window.
Click the button to save the current settings and return to the Contour Task Panel.
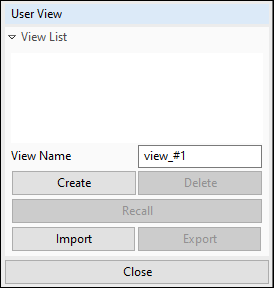
Use this task panel to create and manipulate user views. Access this
right-hand task panel by choosing from the
( ) drop-down menu in the
main toolbar.

Click to hide this task panel. For more information on using this task panel, see Creating User Views.
This panel enables you to set options for the result display of the simulation in the graphics window. The controls available on this task panel are also available on some other task panels of the Analysis Tab.

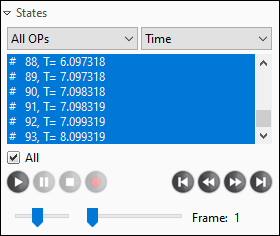
You may select individual States from the list to analyze that state in detail, or check the All check box to select all states and perform an animation of the forming process. You can also choose multiple states or ranges of states using the Control and Shift keys as modifiers.
If you choose a single operation from the first menu ( in the image), you can choose a tool from the second menu ( in the image) and the distance to home for that tool is displayed instead of the state number and time.
Use the playback controls to play, pause, and stop the animated display, or export a recording of the animation to a video file. Use step controls to jump to the first frame, previous frame, next frame, or last frame of the animation. The slider below the playback controls modifies the speed of the animation. The slider below the step controls enables you to scroll quickly through the animation.
Choose from the Analysis Ribbon Elements to display the FLD task panel and display the forming limit diagram (FLD) in the graphics window.
Use the FLD task panel to select individual operations to view, or to play an animation of the forming process. The panel also enables you to set options for display of the FLD. Choose options for showing the strain values and path, and set parameters for the FLD curve and FLD window.
When you are finished with the FLD, click the button to return to the Deformation Task Panel.
Choose from the Analysis Ribbon Elements to display the Thinning task panel and display a plot of material thinning in the graphics window.
Use the Thinning task panel to select individual operations to view, or to play an animation of the forming process. The panel also enables you to choose options to further refine the display of simulation data, list the values of points and regions in the model, and choose contour settings.
When you are finished with the thinning plot, click the button to return to the Deformation Task Panel.
Choose from the Analysis Ribbon Elements to display the Edge Stretch task panel and display the plot in the graphics window.
This panel enables you to display if the critical plastic limit of the material is exceeded at the edge of the sheet. Use the Edge Stretch task panel to select individual operations to view, or to play an animation of the forming process.
The panel also enables you to choose a frame of the animation to use as the Reference State for the relative display, list the values of points and regions in the model, and choose contour settings.
When you are finished with the edge stretch plot, click the button to return to the Deformation Task Panel.
Choose from the Analysis Ribbon Elements to display the Springback Evaluation task panel and view a diagram of the springback in the part.
The springback evaluation diagram enables you to view springback values calculated after operations and measure springback data by comparing the simulated part shape to a reference shape. Either the upper or lower surface of the simulated part can be compared.
The panel enables you to define options and settings for the springback display. If you are measuring the springback values, the panel also enables you to choose the reference shape and how the reference shape and simulated part are located with regards to each other.
The panel also enables you to choose and refine categories of springback data to display, list the values of points and regions in the model, and choose contour settings.
When you are finished with the Springback Evaluation plot, click .
Choose from the Analysis Ribbon Elements to display the Contact Result task panel and view a contour plot of contact data in the graphics window.
Use the Contact Result task panel to select individual operations to view, or to play an animation of the forming process with various categories of contact data displayed as a contour plot on the workpiece.
Choose a Blank and a one of the Tools from the drop-down menus, then select a specific data component.
The panel also enables you to choose options to apply smoothing to the results, list the values of points and regions in the model, and choose contour settings.
When you are finished with the Contact Info. plot, click .
Choose from the Analysis Ribbon Elements to display the Stoning task panel and display a plot of surface deviations in the graphics window.
Use the Stoning task panel to select individual operations to view, or to play an animation of the forming process. Stoning results are most often viewed after all operations are complete, but viewing earlier states may help determine when surface defects first begin to appear.
The panel also enables you to choose options to further refine the display of the stoning analysis, list the values of points and regions in the model, and choose contour settings.
When you choose most options, they are applied to the diagram automatically. When you are finished with the stoning plot, click the button to return to the Deformation Task Panel.
Choose from the Analysis Ribbon Elements to display the Circle Grid task panel and view a plot of analysis data in the graphics window that displays the strain on circular regions in the workpiece.
Use the Circle Grid task panel to select individual operations to view, or to play an animation of the forming process. The panel also enables you to choose options to further refine the display of simulation data, list the values of points and regions in the model, and choose contour settings.
Choose options, then click to display the circle grid plot. Click to apply predefined default options to the plot. When you are finished with the circle grid plot, click the button to return to the Deformation Task Panel.
Choose from the Analysis Ribbon Elements to display the Skidmark task panel and view a plot of analysis data in the graphics window.
Use the Skidmark task panel to select individual operations to view, or to play an animation of the forming process. You must have more than one frame selected to view the animation. The panel also enables you to choose options to further refine the display of simulation data, list the values of points and regions in the model, and choose contour settings.
When you are finished with the skidmark plot, click the button to return to the Deformation Task Panel.
Choose from the Analysis Ribbon Elements to display the Curvature task panel and view a plot of bending moment change data in the graphics window.
Use the Curvature task panel to select individual operations to view, or to play an animation of the forming process. You must have more than one frame selected to view the animation. The panel also enables you to choose options to further refine the display of simulation data, list the values of points and regions in the model, and choose contour settings.
When you are finished with the curvature plot, click the button to return to the Deformation Task Panel.
Choose from the Analysis Ribbon Elements to display the Edge Draw-In task panel and view a plot of analysis data in the graphics window that displays vectors highlighting the draw-in of edges during the forming process.
Use the Edge Draw-In task panel to select individual operations to view, or to play an animation of the forming process. You must have more than one frame selected to view the animation.
By default, only vectors showing draw-in along the XY plane are displayed. Choose other options to define other planes (using the X, Y, and Z check boxes), show vectors that display draw-in vectors perpendicular to the edges of the blank, and show vectors as a history path.
The panel also enables you to choose a frame of the animation to use as the Reference State for the relative display, list the values of points and regions in the model, and choose contour settings.
When you are finished with the edge draw-in plot, click the button to return to the Deformation Task Panel.
Choose from the Analysis Ribbon Elements to display the Material Line task panel and view a plot of analysis data in the graphics window that displays material lines you select.
Use the Material Line task panel to select individual operations to view, or to play an animation of the forming process. You must have more than one frame selected to view the animation. The panel also enables you to select a Mapping Method and select material lines to view.
When you are finished with the material line plot, click the button to return to the Deformation Task Panel.
Choose from the Analysis Ribbon Elements to display the Tonnage task panel.
Use the Tonnage task panel to select one or more operations from the Op list. You can select multiple operations by holding the Control or Shift keys while clicking. Then, click the button to display a tonnage prediction plot for that operation in a new window.
You can add new data to the same plot by selecting new operations from the Op list and clicking the button again, or choose from the button's drop-down menu to display a new Tonnage Prediction window.
When you are finished with the Tonnage task panel, click the button to return to the Deformation Task Panel.
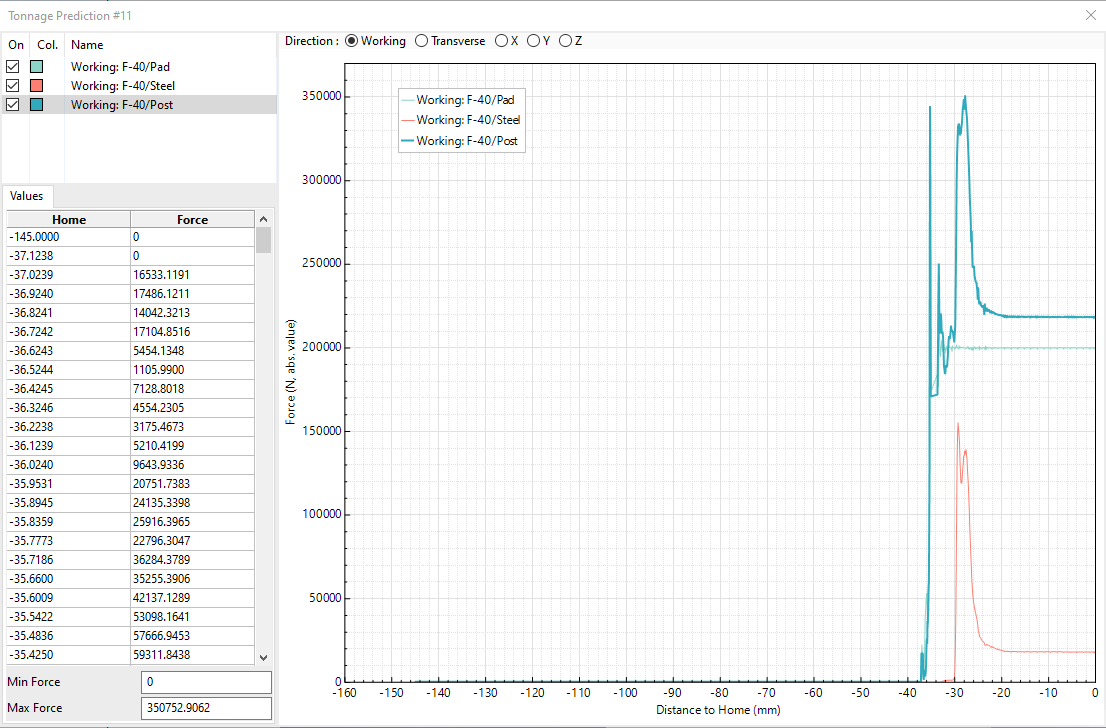
Choose or from the Tonnage Task Panel ribbon to display a Tonnage task panel and view a plot of analysis data in the graphics window that displays the force of each operation (in Newtons) over the Distance to Home (in millimeters).

Use the Tonnage task panel to add more data to this plot. A list shows which operations are displayed in the plot, and which color has been assigned to each. Turn display of individual operations on and off by checking or clearing the check box next to that operation in the list. Remove an operation and its curve from the plot by right-clicking on that operation and choosing from the context menu.
You can also apply a scaling factor to an operation's values, or sum the values of two or more operations to display combined force. See Viewing Tonnage Predictions for more information.
The Values table displays the Force data values that are shown in the plot. Minimum Force and Maximum Force obtained during analysis are displayed below the Values table. Select an operation in the list to display the values for that operation. Select a value in the table to display an "×" on the plot where that value appears. You can also select multiple values or ranges of values using the Control and Shift keys as modifiers.
Radio buttons above the plot enable you to choose the direction over which force will be displayed. Choose from Working, Transverse, X, Y, and Z. Choose a direction to display the force predictions in that direction only.
Right-click the plot to open a context menu from which you can copy the plot image to the clipboard, export the plot image to a file, and modify plot display settings.
When you are finished with the Tonnage Prediction plot, click the button in the window's title bar.
Choose from the Analysis Ribbon Elements to display the Contour task panel and view a contour plot of analysis data in the graphics window.
Use the Contour task panel to select individual operations to view, or to play an animation of the forming process with various categories of data displayed as a contour plot on the workpiece.
Choose a Category of data from the drop-down menu, then select a specific type of data. If the data has layer information associated with it, choose from the drop-down menu.
The panel also enables you to choose options to further refine the display of simulation data, list the values of points and regions in the model, and choose contour settings.
To display markers at the nodes that have the maximum and minimum value in the current plot, choose from the Options Tool in the ribbon. The maximum value in the plot in the current frame will be marked with a plus ("+") and the minimum value will be marked with an asterisk ("∗").

When you are finished with the Contour plot, click .
Choose from the Analysis Ribbon Elements to display the Vector task panel and view a plot of analysis data in the graphics window that displays Stress, Strain, or Ndv values of each operation as vectors on the workpiece.
Choose a category of data from the drop-down menu, then select a specific type of data. If the data has layer information associated with it, choose from the drop-down menu. Change the scaling value of the vectors by entering a new value for Tensor Display Scale and clicking . Select other component options using the check boxes.
The panel also enables you to choose options to further refine the display of simulation data, list the values of points and regions in the model, and choose contour settings.
When you are finished with the Vector plot, click .
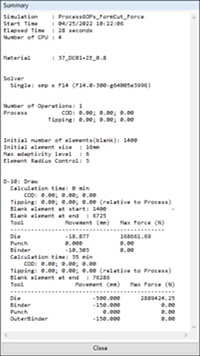
Choose from the Additional Tools  drop-down menu to display the
Summary task panel and view a text report of simulation details
and statistics about the simulation process.

You can highlight text in the summary using the mouse pointer, just as in most text editors. Right-click in the task panel to display a context menu of Summary-specific commands such as and , and display options such as right-to-left reading order and Unicode character commands.
When you are finished with the Summary task panel, click .
For more information about the data contained in the Summary, see Viewing a Simulation Summary.

