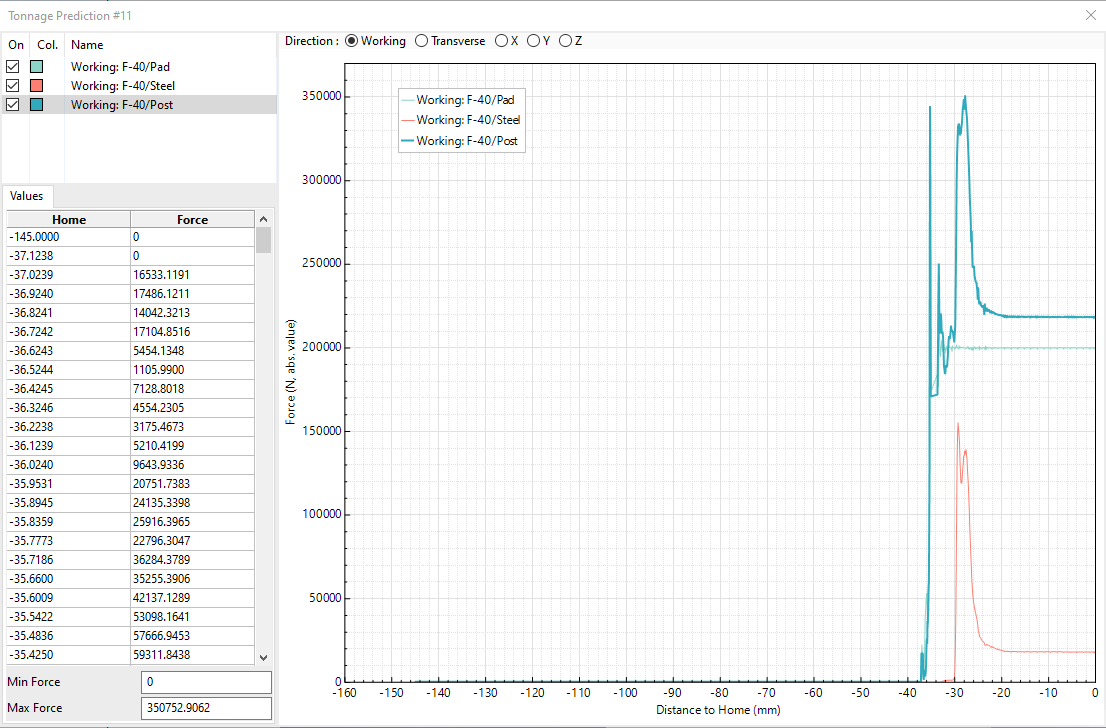
The tonnage prediction plot displays plot tonnage predictions versus displacement for selected operations. Choose from the Analysis Ribbon Elements to display the Tonnage task panel.
Use the Tonnage task panel to select one or more operations from the Op list. You can select multiple operations by holding the Control or Shift keys while clicking. Then, click the button to display a tonnage prediction plot for the selected operations in a new window.
Choose or from the Tonnage Task Panel ribbon to display a Tonnage task panel and view a plot of analysis data in window that displays the force of each operation (in Newtons) over Distance to Home (in millimeters).
Radio buttons above the plot enable you to choose the direction over which force will be displayed. Choose from Working, Transverse, X, Y, and Z. Choosing different directions will make different values available and display different curves in the plot.
A list shows which operations are displayed in the plot, and which color has been assigned to each. Turn display of individual operations on and off by checking or clearing the check box next to that operation in the list. During an operation, tonnage predictions are influenced most significantly by any force control options you may have added to the operation. See Adding Force Control for more information.
Remove an operation and its curve from the plot by right-clicking on that operation and choosing from the context menu.
The Values table displays the Force data values that are shown in the plot. Minimum Force and Maximum Force obtained during analysis are displayed below the Values table.
You can add new data to the same plot by selecting new operations from the Op list in the task panel and clicking the button again, or choose from the button's drop-down menu to display a new Tonnage Prediction window.
Apply a scaling factor to an operation's values to make changes more visible:
Select one or more operations in the list. You can select multiple operations or ranges of operations using the Control and Shift keys as modifiers.
Right-click a selected operation and choose from the context menu.
Enter a scaling value in the dialog box.
Click .
Sum the values of two or more operations to display combined force:
Select two or more operations in the list. You can select multiple operations or ranges of operations using the Control and Shift keys as modifiers.
Right-click the selected operations and choose from the context menu.
Both of those commands add a descriptive item to the list that can be manipulated like any other operation.
When you are finished with the Tonnage Prediction plot, click the button in the window's title bar.
When you are finished with the Tonnage task panel, click the button to return to Viewing Basic Deformation Results.


