


In industries such as aerospace and automotive, it is useful and informative to understand how forces and moments develop along certain directions, such as along a car's length. This provides valuable insights on which region is contributing more forces and moments to the model. Using the Cumulative Plot dialog box you can specify the type of cumulative plot (force, moment, force coefficient, or moment coefficient) and select which surfaces to include as well as how many "slices" to make through the model.
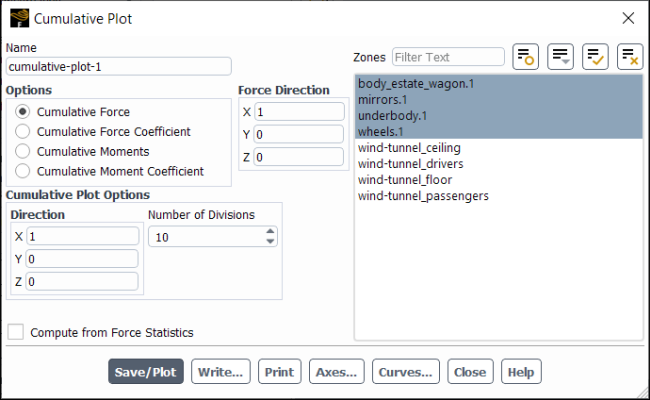
You can create a cumulative plot of force, moment, force coefficients, and moment coefficients using Cumulative Plot Dialog Box (Figure 40.128: The Cumulative Plot Dialog Box).
![]() Results → Plots
→ Cumulative Plot
→ New...
Results → Plots
→ Cumulative Plot
→ New...
The steps for generating a cumulative plot are as follows:
(Optional) Provide a Name for the cumulative plot.
Select the type of cumulative plot in the Options group box:
Cumulative Force
Cumulative Force Coefficient
Cumulative Moments
Cumulative Moment Coefficient
Specify the Direction and Number of Divisions (in the Cumulative Plot Options group box). Along this direction, Fluent creates divisions on the selected surfaces and computes the cumulative force or moments.
Direction—the planes created according to the Number of Divisions will be perpendicular to this direction.
Number of Divisions—how many slices or cuts perpendicular to the Direction will be made through the selected Wall Zones for plotting the selected quantity.
Specify the Force Direction (for Cumulative Force and Cumulative Force Coefficient) or the Moment Center and Moment Axis (for Cumulative Moments and Cumulative Moment Coefficient).
(Optional) Enable Compute from Force Statistics to use averaged values instead of instantaneous values in the plot. This option is only available if Force Statistics is enabled in the Sampling Options Dialog Box.
Select the desired Zones to include in the cumulative plot.
Click .