


This tutorial is divided into the following sections:
This tutorial demonstrates the setup and solution of a proton exchange membrane (PEM) electrolyzer using the electrolysis model in Ansys Fluent.
The 3D PEM electrolyzer geometry consists of a membrane electrode assembly (MEA), current collectors, and bipolar plates with flow channels.
This tutorial illustrates how to do the following:
Set up a PEM electrolyzer simulation using the electrolysis model in Ansys Fluent
Define solid materials for the anode, cathode, and electrolyte
Initiate and solve the electrolysis simulation using the pressure-based solver
Obtain the electrolyzer simulation results and perform postprocessing activities
To learn more about electrolysis modeling, see Electrolysis and H2 Pump Model in the Fluent Theory Guide and Setting the Electrolysis and H2 Pump Model in the Fluent User's Guide.
This tutorial is written with the assumption that you have completed the introductory tutorials found in this manual and that you are familiar with the Ansys Fluent outline view and ribbon structure. Some steps in the setup and solution procedure will not be shown explicitly.
The 3D electrolyzer model described in [1] is considered in this tutorial. The geometry of the PEM electrolyzer with bipolar plates is schematically shown in Figure 33.1: Schematic of the Electrolyzer Problem.
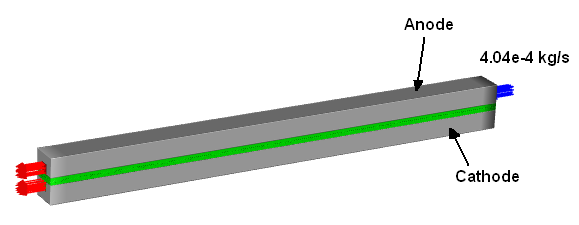
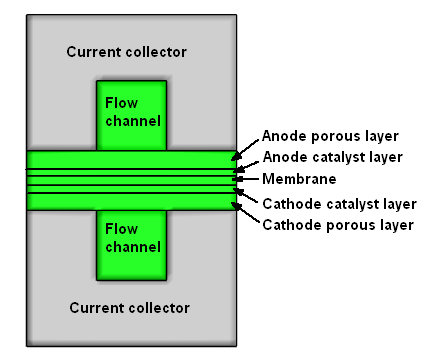
Liquid water is supplied through the anode flow channel at 333.15 K and a mass flow rate of 0.000404 kg/s. It flows through the porous layers to the catalyst layers where electrochemistry reactions occur. During the electrochemistry reactions, gaseous hydrogen is produced in the cathode catalyst layer, and oxygen is produced in the anode catalyst layer. Then gaseous hydrogen and oxygen are transported out of the catalyst layer through the flow channels to the anode and cathode outlets where hydrogen and oxygen, along with the remaining liquid water, are discharged from the electrolyzer. See Figure 33.2: The Electrolyzer Cross-Section.
In this tutorial, the electrolysis model is used to simulate a 3D PEM electrolyzer. For the PEM electrolysis, the electrochemistry reactions are given by:

The electrochemistry reaction rates in the catalyst layers are calculated using the Butler-Volmer formulation, which determines the production rates of hydrogen and oxygen. Due to the presence of liquid water and gaseous hydrogen and oxygen, the multiphase model is used in the modeling. Two potential equations are solved to track the electrical currents and ionic currents, respectively.
The following sections describe the setup and solution steps for this tutorial:
Download the
electrolysis.zipfile here .Unzip
electrolysis.zipto your working directory.The mesh file
electrolysis.msh.h5can be found in the folder.Use the Fluent Launcher to start Ansys Fluent.
Select Solution in the top-left selection list to start Fluent in Solution Mode.
Select 3D under Dimension.
Enable Double Precision under Solver Options.
Set Solver Processes to
4under Parallel (Local Machine).
Read the mesh file
electrolysis.msh.h5. File → Read →
Mesh...
File → Read →
Mesh...When prompted, browse to the location of the
electrolysis.msh.h5and select the file.Once you read in the mesh, it is displayed in the embedded graphics windows.
Check the mesh.
Domain → Mesh
→ Perform Mesh Check
The following sections describe the setup steps for this tutorial:
Set the solver settings.
![]() Physics → Solver
→ General...
Physics → Solver
→ General...

In the General task page, retain the default setting of Pressure-Based under Type (Solver group box).
Retain the default selection of Steady in the Time group box.
Enable the potential/electrochemistry model.
Physics → Models
→ More
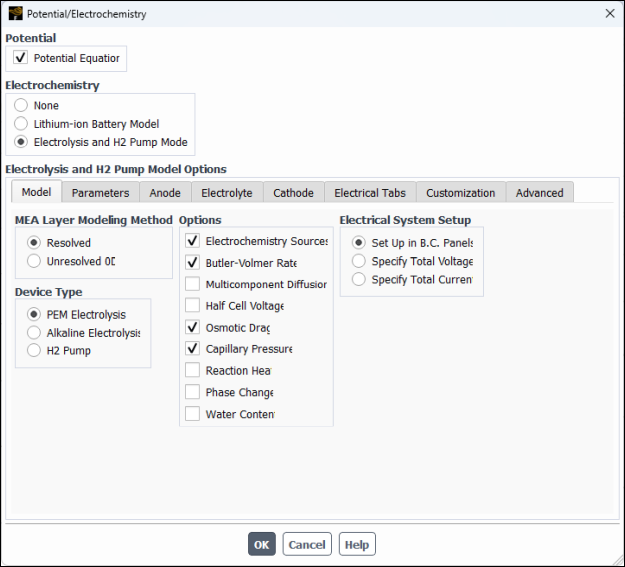
→ Potential/ElectrochemistryIn the Model tab (see Figure 33.3: Potential/Electrochemistry Dialog Box - Model Tab), configure the following settings:
Group Box Control or List Value or Selection MEA Layer Modeling Method
Resolved
(Selected)
Device Type
PEM Electrolysis
(Selected)
Options
Electrochemistry Sources
(Selected)
Butler-Volmer Rate
(Selected)
Osmotic Drag
(Selected)
Capillary Pressure
(Selected)
Electrical System Setup
Specify Total Voltage
(Selected)
Total Voltage
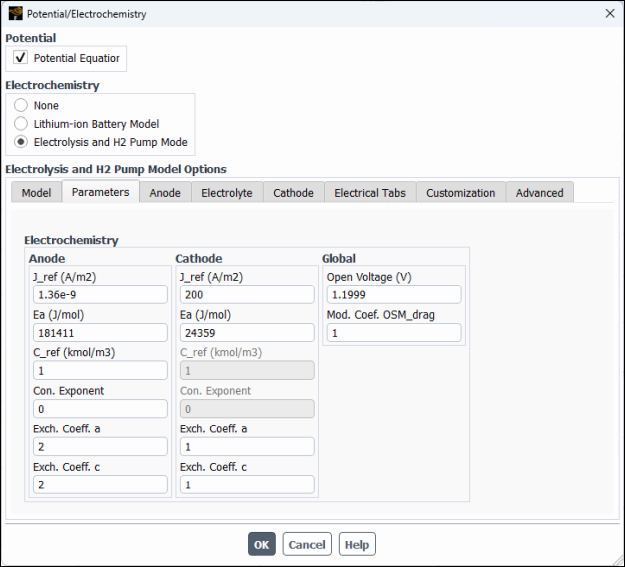
1.730202VIn the Parameters tab (see Figure 33.4: Potential/Electrochemistry Dialog Box - Parameters Tab), configure the following settings:
Group Box
Control or List
Value or Selection
Anode
J_ref
1.36e-9A/m2Ea
181411J/molC_ref
1kmol/m3 (Default)Con. Exponent
0Exch. Coeff. a
2(Default)Exch. Coeff. c
2(Default)Cathode
J_ref
200A/m2Ea
24359J/molC_ref
1kmol/m3 (Default)Con. Exponent
0(Default)Exch. Coeff. a
1Exch. Coeff. c
1Global
Open Voltage 1.1999VMod. Coef. OSM_Drag 1(Default)Note: The input values for the electrolyzer considered in this tutorial are taken from [1]. These inputs may not be appropriate for your electrolysis device. You must provide inputs suitable for your case.
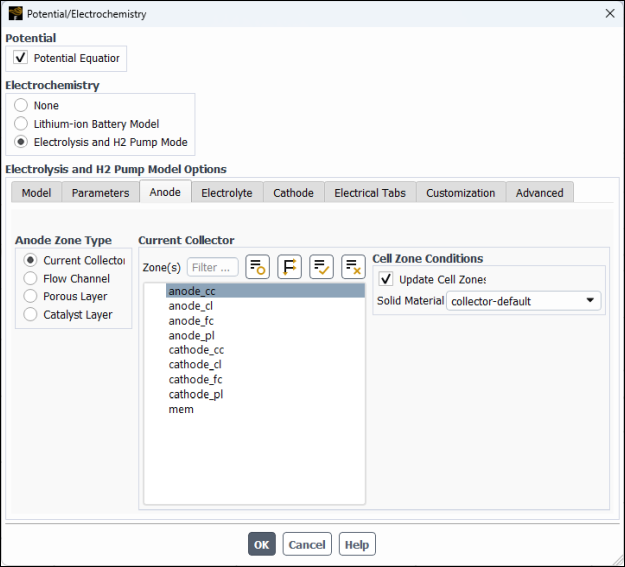
In the Anode tab, specify settings for the anode zones.
In the Anode Zone Type group box, select Current Collector, and then in the Zone(s) multiple-selection list, select
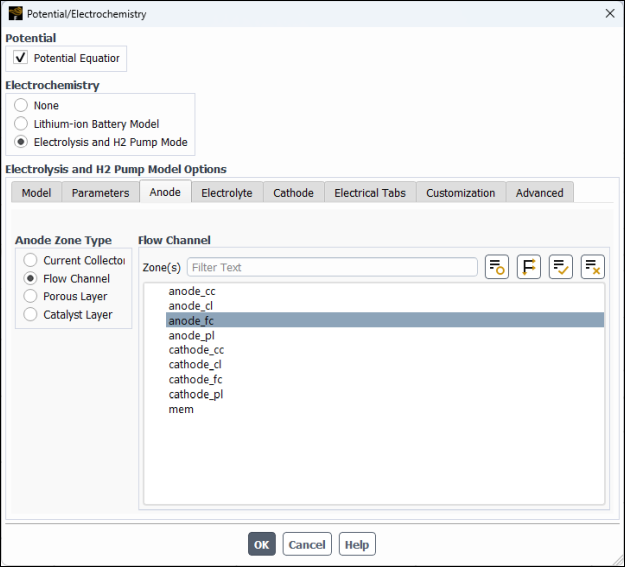
anode_ccand retain the default selection of collector-default for Solid Material.In the Anode Zone Type group box, select Flow Channel, and then in the Zone(s) multiple-selection list, select
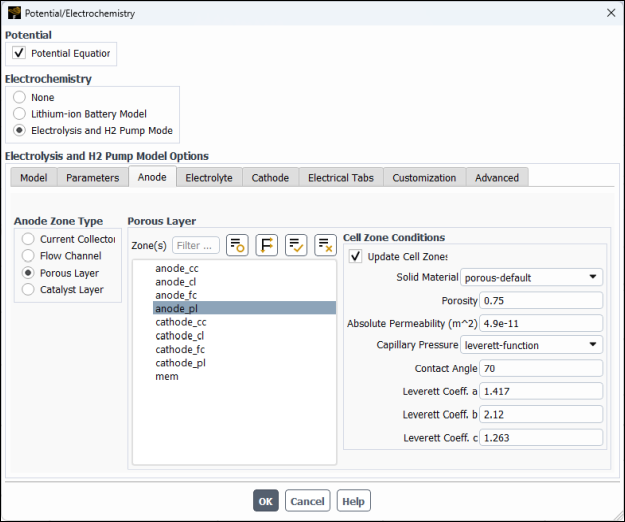
anode_fc.In the Anode Zone Type group box, select Porous Layer and then and then configure the following settings (see Figure 33.7: Potential/Electrochemistry Dialog Box - Anode Porous Layer).
In the Zone(s) multiple-selection list, select
anode_pl.In the Cell Zone Conditions group box, modify the following settings:
Set Porosity to
0.75.Set Absolute Permeability to
4.9e-11m2.Set Contact Angle to
70degrees.Retain the remaining default settings.
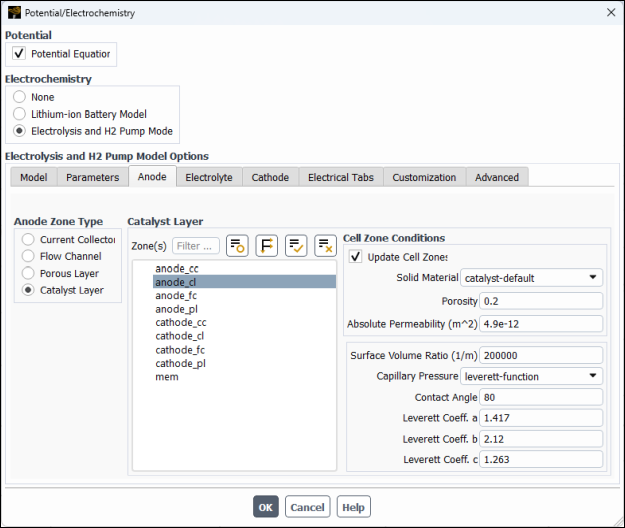
In the Anode Zone Type group box, select Catalyst Layer and then configure the following settings (see Figure 33.8: Potential/Electrochemistry Dialog Box - Anode Catalyst Layer.
In the Zone(s) multiple-selection list, select
anode_cl.In the Cell Zone Conditions group box, modify the following settings:
Set Porosity to
0.2.Set Absolute Permeability to
4.9e-12m2.Set Contact Angle to
80degrees.Retain the remaining default settings.
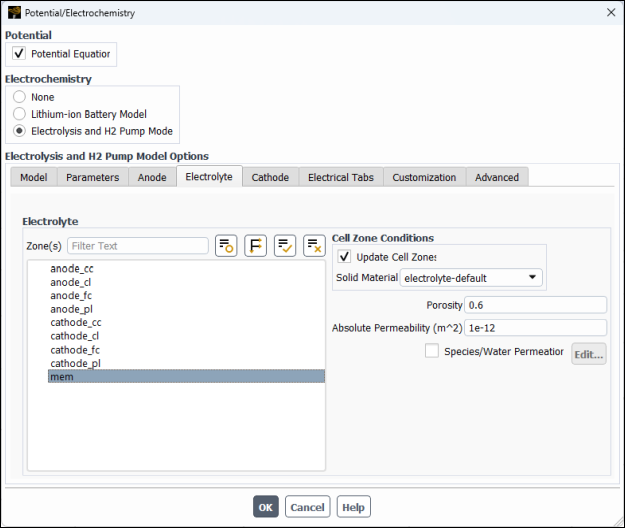
In the Electrolyte tab, configure the following settings for the electrolyte/membrane.
Group or List
Control or Zone
Value or Selection
Zone(s)
mem(Selected)
Cell Zone Conditions Solid Material
electrolyte-defaultPorosity
0.6(default)Absolute Permeability
1e-12m2 (default)In the Cathode tab, specify settings for the cathode zones (in a manner similar to the anode zones).
For the cathode current collector, configure the following settings:
Group or List
Control or Zone
Value or Selection
Cathode Zone Type
Current Collector
(Selected)
Zone(s) cathode_cc(Selected)
Cell Zone Conditions Solid Material
collector-defaultFor the cathode flow channel, configure the following settings:
Group or List
Control or Zone
Value or Selection
Cathode Zone Type
Flow Channel
(Selected)
Zone(s) cathode_fc(Selected)
For the cathode porous layer, configure the following settings:
Group or List
Control or Zone
Value or Selection
Cathode Zone Type
Porous Layer
(Selected)
Zone(s) cathode_pl(Selected)
Cell Zone Conditions Solid Material
porous-defaultPorosity
0.75Absolute Permeability
1e-11m2Contact Angle
60degrees (Default)For the cathode catalyst layer, configure the following settings:
Group or List
Control or Zone
Value or Selection
Cathode Zone Type
Catalyst Layer
(Selected)
Zone(s) cathode_cl(Selected)
Cell Zone Conditions Solid Material
catalyst-defaultPorosity
0.2Absolute Permeability
2e-12m2Contact Angle
60degrees (Default)
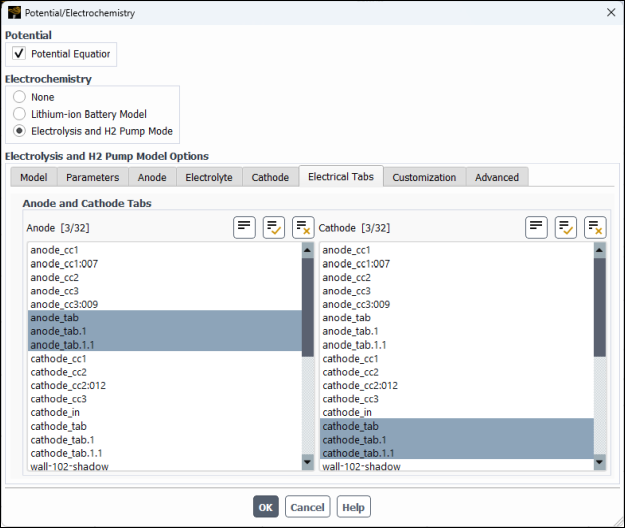
In the Electrical Tabs tab, specify external anode and cathode tabs.
In the Anode multiple-selection list, select
anode_tab,anode_tab.1,anode_tab.1.1.In the Cathode multiple-selection list, select
cathode_tab,cathode_tab.1,cathode_tab.1.1.
Click to close the Potential/Electrochemistry dialog box.
In the background, Fluent automatically makes the following changes:
Adjusts the solver settings. The information about the changes is printed in the console window.
Sets the species model. A mixture material called pem-mixture (consisting of nitrogen, oxgen, hydrogen, and water-vapor) is automatically created.
Sets the mixture multiphase model. The pem-mixture mixture material is assigned to the primary phase. water-liquid is assigned to the secondary phase. The primary phase (phase-1) is selected for a species mixture material in the Species Model dialog box.
Enables the energy equation.
Adjust electrical conductivity and electrolyte conductivity for the solid materials
(catalyst-default, porous-default,
catalyst-default, and
electrolyte-default).
Modify properties of the collector material.
 Setup → Materials
→ Solid
→
Setup → Materials
→ Solid
→ collector-default Edit...
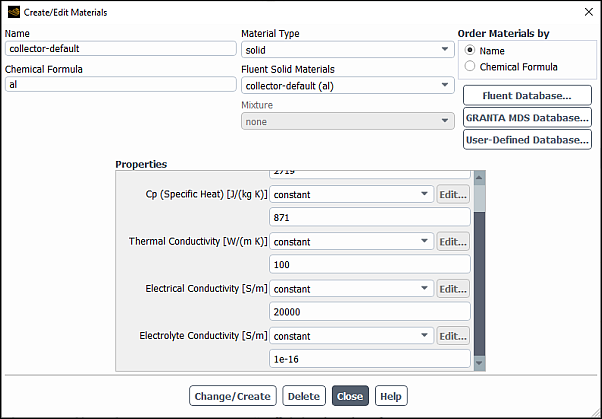
In the Create/Edit Materials dialog box, make sure that solid is selected for Material Type, and
collector-defaultis selected for Fluent Solid Materials.In the Properties group box, set Electrical Conductivity to
20000and Electrolyte Conductivity to1e-16.Click the button.
In a similar manner, modify properties of the porous material as follows.
Important: You must click to save the settings for each material before selecting the next material. Otherwise, your edits will be lost.
Fluent Solid Materials
Property
Value
porous-defaultElectrical Conductivity
20000Electrolyte Conductivity
1e-16catalyst-defaultElectrical Conductivity
5000Electrolyte Conductivity
4.5electrolyte-defaultElectrical Conductivity
1e-16Electrolyte Conductivity
11Close the Create/Edit Material dialog box.
Set the boundary conditions at a mass-flow inlet for the mixture phase and phase-2.
![]() Setup → Boundary
Conditions → Inlet
→ anode_in
Setup → Boundary
Conditions → Inlet
→ anode_in
![]() Edit...
Edit...
In the Outline View, right-click anode_in (under the Setup/Boundary Conditions/Inlet tree branch) and select Edit... from the menu that opens.
In the Mass Flow Inlet dialog box that opens, define the boundary conditions for the mixture phase.
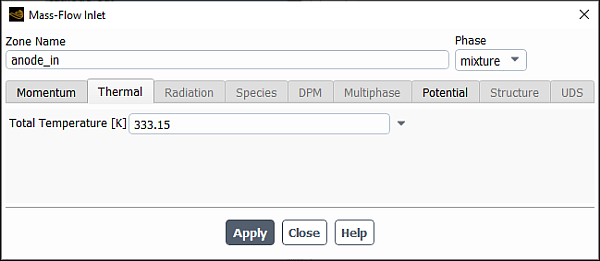
Make sure that mixture is selected from the Phase drop-down list.
In Thermal tab, enter
333.15K for Total Temperature.Click .
Define the boundary conditions for phase-2.
From the drop-down list, select .
In Momentum tab, retain the default selection of Mass Flow Rate for the Mass Flow Specification Method.
Enter
0.000404kg/s for Mass Flow Rate.Click .
Close the Mass Flow Inlet dialog box.
Note: Since phase 1 is not present at the inlet, its mass flow rate is 0 kg/s, which is a default value.
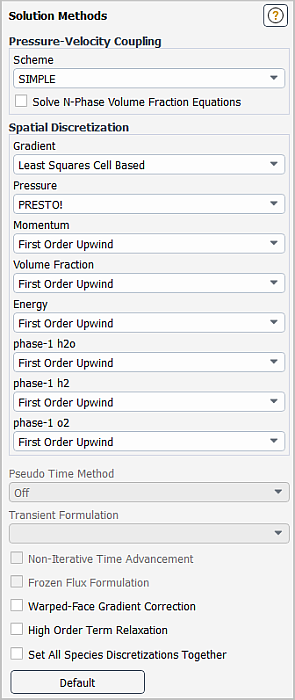
In the Solution Methods task page, retain the default settings for the Pressure-Velocity Coupling and Spatial Discretization.
Solution → Solution
→ Methods...
In the Solution Controls task page, adjust the solution settings.
Solution → Controls
→ Controls...
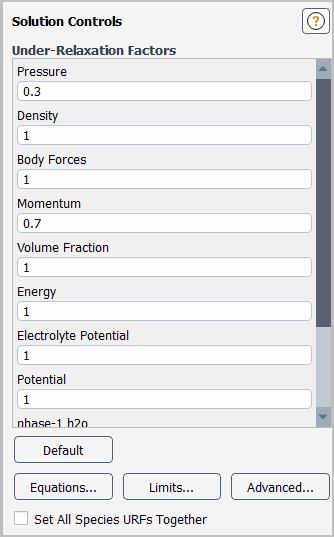
Enter
1.0for Volume Fraction in the Under-Relaxation Factors group box.In electrolysis applications, the velocities (or convection) are relatively small, and diffusion dominates the flow inside porous zones. Therefore, setting the volume fraction under-relaxation factor to 1.0 is recommended for a faster convergence.
Retain the default values for the remaining under-relaxation factors.
Enable the plotting of residuals during the calculation.
Solution → Reports
→ Residuals...
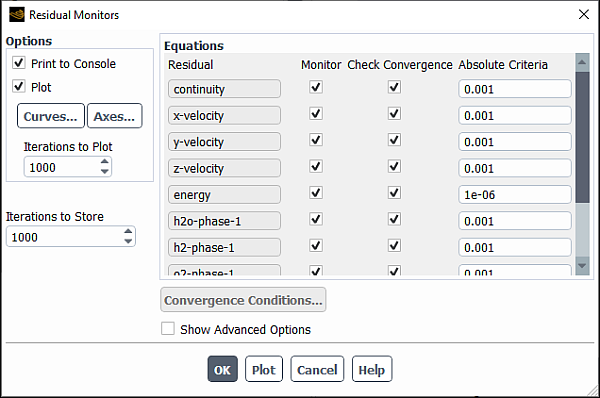
Ensure that Plot is enabled in the Options group box.
Click to close the Residual Monitors dialog box.
Initialize the field variables using the Standard Initialization method.
Solution →  Initialization
Retain the selection of Standard from the Initialization Methods group box.
Modify the Initial Values as follows:
Set Temperature to 333.15 K.
Set phase-2 Volume Fraction to 1.
Scroll down the Initial Values list to find phase-2 Volume Fraction.
Click Initialize.
Save the case file (
electrolysis.cas.h5). File → Write
→ Case...
Run the simulation.
Solution → Run
Calculation → Run Calculation...Enter
300for Number of Iterations.Click Calculate.
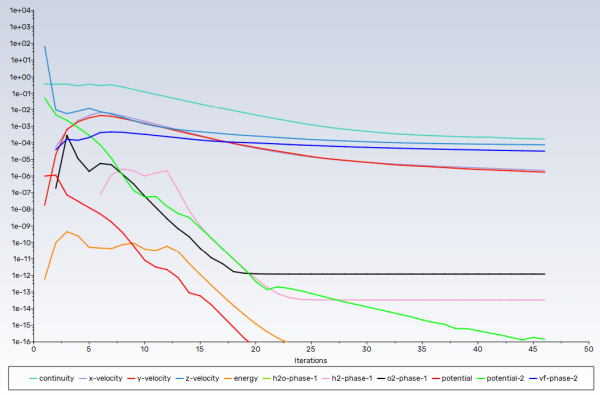
As the solution progresses, the residuals history will be plotted in the Scaled Residuals tab in the graphics window (see Figure 32.5: Residual History of the Simulation.
Save the case and data files (
electrolysis.cas.h5andelectrolysis.dat.h5). File → Write
→ Case & Data...
Compute the volume integral of transfer current at the anode and cathode catalyst layers to verify that they have the same values (which indicates the total current at the anode and cathode sides are the same).
Results → Reports
→ Volume Integrals...
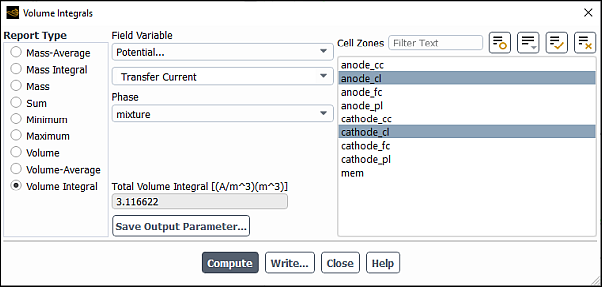
Select Volume Integral as the Report Type.
From the Field Variable drop-down lists, select Potential... and Transfer Current.
In the button next to the Surfaces filter and from the drop-down list, select Surface Type (under Group By).
In the multiple selection list, select
anode_clandcathode_cl.Click Compute.
Ansys Fluent reports in the Total Volume Integral field and in the console that the total volume integral for transfer current at the anode and cathode catalyst layers is approximately 3.12 A. The results printed in the console show that the total volume integrals for the
anode_clandcathode_clcell zones are the same, which indicates that the total current is balanced on the anode and cathode sides.Close the Volume Integrals dialog box
Create iso-surfaces through the electrolyzer geometry for postprocessing purposes.
Results → Surface
→ Create
→ Iso-Surface...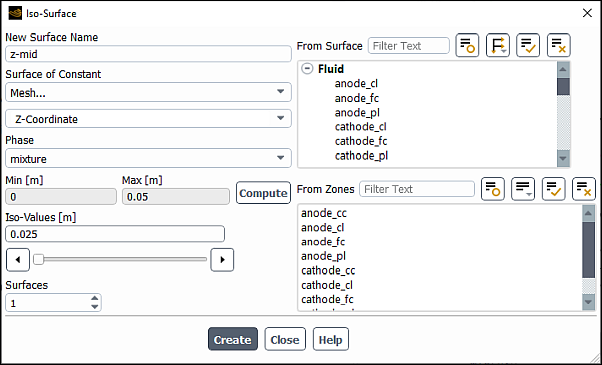
In the Iso-Surface dialog box, enter
z-midfor Name.From the Surface of Constant drop-down lists, elect Mesh... and Z-Coordinate.
Click .
The Min and Max fields display the Z extents of the domain.
Enter
0.025m for Iso-Values.Click Create.
Enter
x-midfor Name.From the Surface of Constant drop-down lists, elect Mesh... and X-Coordinate.
Click .
The Min and Max fields display the X extents of the domain.
Enter
0.0015m for Iso-Values.Click Create and close the Iso-Surface dialog box..
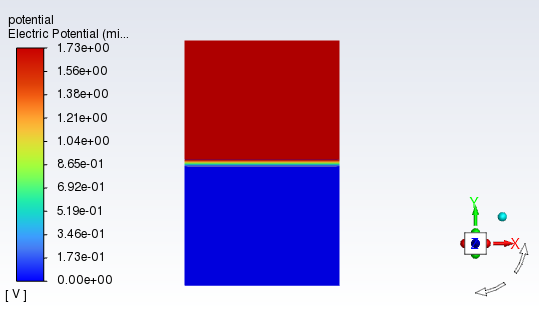
Display contours of potential on the z-mid cross-sectional surface.
Results → Graphics
→ Contours → New...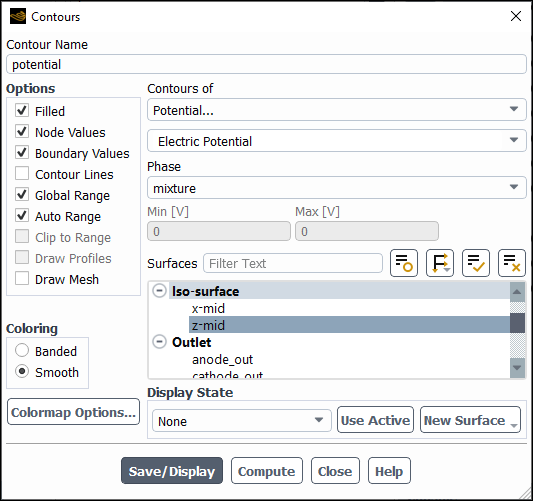
In the Contours dialog box, enter
potentialfor Contour Name.Ensure that Filled is enabled in the Options group box.
Retain the selection of Smooth in the Coloring group box.
From the Contours of drop-down list, select Potential... and Electrical Potential.
In the Phase drop-down list, retain the default selection of mixture.
From the Surfaces selection list, select z-mid.
Click Save/Display and close the Contours dialog box.
Figure 33.12: Electric Potential Distribution shows that electric potential on the cathode side is lower than that on the cathode side. The major electric potential changes occur inside the catalyst layers due to electrochemistry reactions in catalyst layers.
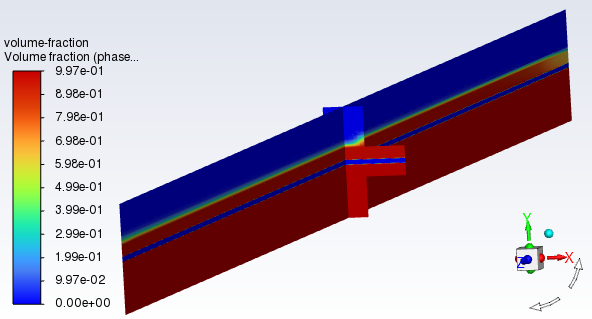
In a similar manner, display the contour of volume fraction of phase-1(pem-mixture) on the x-mid and z-mid iso-surfaces.
Results → Graphics
→ Contours → New...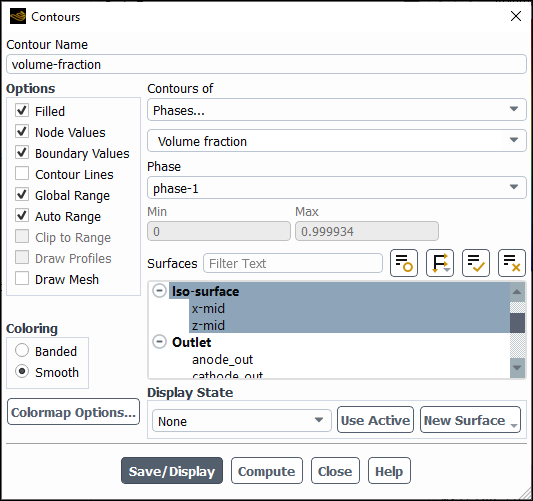
Enter
volume-fractionfor Contour Name.Ensure that Filled is enabled in the Options group box.
Retain the selection of Smooth in the Coloring group box.
From the Contours of drop-down list, select Phases... and Volume Fraction.
From the Phase drop-down list, select phase-1.
From the Surfaces selection list, select x-mid and z-mid.
Click Save/Display and close the Contours dialog box.
Figure 33.13: Total Heat Generation Rate shows that the volume fraction of phase-1 on the cathode side is 0.997 due to the production of gaseous H2. On the anode side, gaseous O2 is produced and is mixed with the remaining liquid water that has not yet reacted.
Save the case file (
electrolysis.cas.h5). File → Write
→ Case...
In this tutorial, you learned how to model PEM electrolysis in a 3D PEM electrolyzer using the electrolysis model in Ansys Fluent. You learned how to define solid materials for the anode, cathode, and electrolyte and set up boundary conditions for the mixture and phases. The steps to perform various forms of postprocessing were also described.