The Query menu provides access to basic information querying functions, the query generation dialogs and the interactive probe dialog.
Note: Only parts with data residing on the Server host system may be queried. Therefore, parts that reside exclusively on the Client host system (i.e. contours, particle traces, profiles, vector arrows) may NOT be queried Table 1.1: Part Creation and Data Location.
|
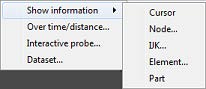
Show information |
Opens the following pull-down menu (see Get Point, Node, Element, & Part Info).
|
|
|
Cursor |
Provides the following information in the Status History Area about a Point inside of the selected Part(s) who's position is specified with the cursor tool (see Use the Cursor (Point) Tool): x,y,z coordinates, Frame assignment of Point, the Part that the Point is found in, the closest Node to the Point, the element id if it exists, and the active Variable values at the Point. |
|
|
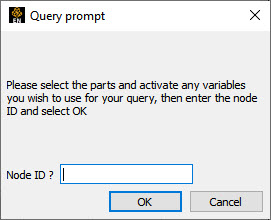
Node... |
Opens the Query Prompt dialog which is used to specify Node ID number. When the button is pressed, the following information about the specified Node is shown in the Status History Area: x,y,z coordinates, Frame assignment of Node, the Part that the Node is found in, the element id if it exists, and all active nodal Variable values at the Node.
|
|
|
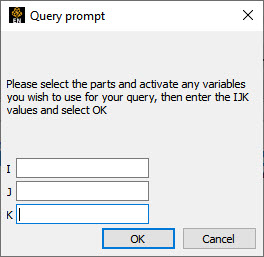
IJK... |
Opens the Query Prompt dialog which is used to specify IJK values. When the OK button is pressed, the following information about the Node specified by the IJK values is shown in the Status History Area: Node ID, Part in which the Node is located, x,y,z coordinates of the Node, Frame assignment of the Node, and the specified Variable value at the Node.
|
|
|
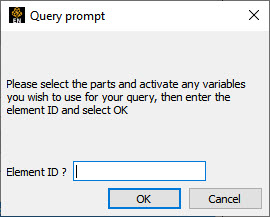
Element... |
Opens the Query Prompt for Element ID. When the button is pressed, the following information about the Element is shown in the Status History Area: Par in which Element is located, Type of Element, IJK bounds (if a structured mesh), Number of Nodes, Node ID numbers, information on neighboring Elements, and all active elemental Variable values at the Element.
|
|
|
Part |
Causes the following information about the select Part to be shown in the Status History Area: Part type (structured or unstructured), number of Nodes in Part, minimum and maximum x,y,z coordinates, Element type, min/max node labels if exist, min/max element labels if exist, and the number of Elements. |
|
|
Over time/distance... |
Opens the Query/Plot Editor in the Feature Panel which is used to obtain information about variables and to create plots of the information (see 5.3, Query/Plotter and Query/Plot). |
|
|
Interactive probe... |
Opens the Interactive Probe Query Editor in the Feature Panel which is used to obtain information interactively about variables (5.8, Interactive Probe Query and Probe Interactively). |
|
|
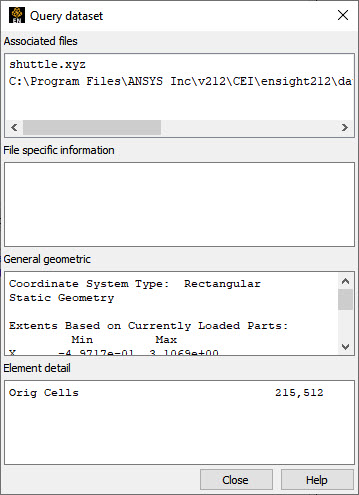
Dataset... |
Opens the Query Dataset dialog, which provides information about the dataset loaded in the current case. This can be useful to verify the files that you are using, whether the geometry is static, changing coordinates, or changing connectivity, and the number of each element type in your dataset. For the specified file, specific, general and detail information is provided (see 5.3, Query/Plotter and Query Datasets).
|
|
|
For the specified file, specific, general and detail information is provided. Query → Dataset... |
||
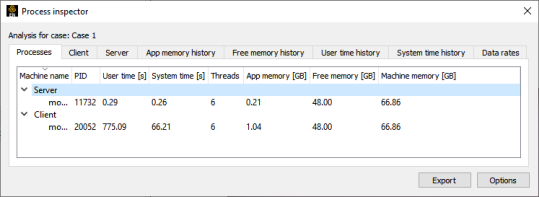
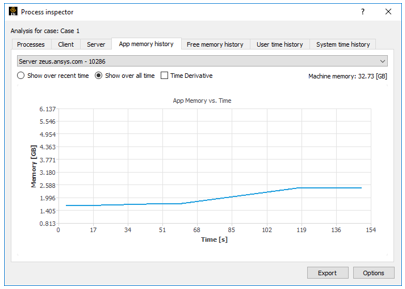
| Process inspector... |
Opens the Process Inspector dialog, that reports the status of EnSight. At the top, the Case number of the active case is reported. Changing the active case or the number of servers will reset the collection of information.
|
|
| Processes | Processes for the client, SOS and the server are listed here. PID, user time, system time, maximum number of threads, memory used by the process and free memory on the machine are reported here. The SOS process and multiple servers will be visible only if EnSight is running with Spatial parallel. Temporal parallelism will result in one single server and no SOS process. | |
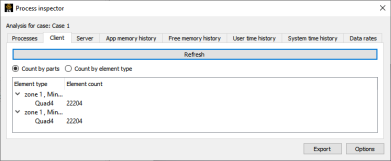
| Client |
List of all the parts with their client representation is reported here. Click on the button if you change the part representations to update the information. Toggle the to get the information aggregated on all the parts.
|
|
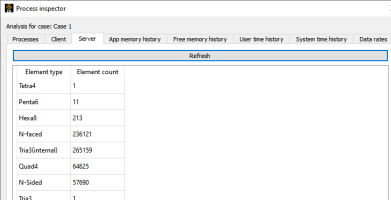
| Server |
List of all the elements on the server aggregated by element type. If multiple servers are available, the information is the cumulative information on all servers. Click on the buttons if the parts have changed and you want to update the information.
|
|
| History |
The history of the application memory, machine free memory, user time and system time is reported. At the top, a pull-down menu allows you to select which process you want to be looking at. A toggle allows you to choose whether you want to plot vs. all time or only the last 100 seconds. A toggle on the right allows you to visualize the derivative of the plot. The first two tabs also report the total memory on the machine where the process is running. |
|
| Export and Options | The export button will create one .csv file for each tab. The options button allows you to set the time interval for the collection of information. If the time to update is set to zero, the data will stop being collected. | |