Overview
EnSight provides several ways to examine information about variable values. You can, of course, visualize variable values with fringes, contours, vector arrows, profiles, isosurfaces, etc. This section describes how to query variables quantitatively:
| Over Distance |
EnSight can query variables at points over distance for the following information:
|
| Over Time |
EnSight can query variables over time for the following information:
Over-time queries can report actual variable values, or Fast Fourier Transform (FFT) spectral values at the positive FFT frequencies. |
| Variable vs. Variable | EnSight can produce a scatter plot of one variable vs. another. |
| Operations on |
EnSight can scale query values and/or combine one set of query values with another set to produce a new set of values. |
| EnSight | EnSight can import query values from external files. |
Only Parts with data residing on the Server host system may be queried. Therefore, Parts that reside exclusively on the Client host system (i.e. contours, particle traces, profiles, vector arrows) may NOT be queried.
(see Created Parts).
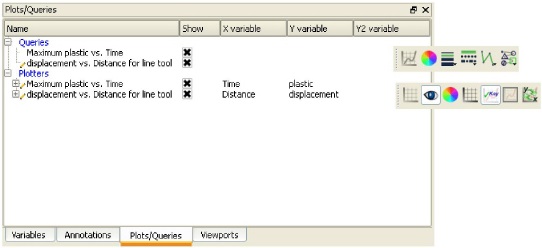
Clicking once on the Query icon opens the Feature Panel for Query/Plots. This editor is used to both create and edit queries and plots. Plots can be selected in the graphics window by left click, and multiple items can be selected by holding down Ctrl while left clicking. Selection is also available via the Plots/Queries list panel. Upon selection of a query or plot, the Quick Action Icon Bar shows attributes that can be edited. Right-click selection in both areas provide a menu of options for editing, creating, and access to the full Feature Panel.
The Plots/Queries panel gives a user modifiable view of the plots and queries that already exist. The toggles, in the Show column, turn visibility on/off, whereas the other column items are display only. Selection is accomplished via right and left mouse buttons. Multiple disjoint items can be selected by holding Ctrl as the mouse is clicked and multiple sequential items by holding the Shift. Double-click displays the Feature Panel. Any item currently in edit mode will display a pencil icon near it.
|
Query Tab |
||
|
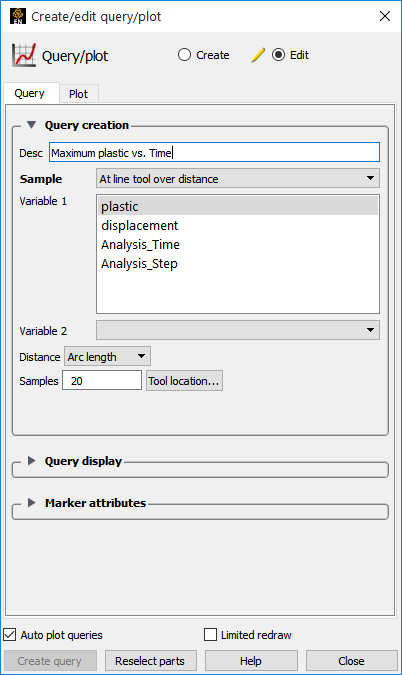
Query creation |
||
|
Description |
This is the title for the query. You can provide it, edit it, etc. A default one
is created if you do not provide one. The title needs to be unique, therefore, if you
enter a string that is already used by another query object, EnSight will
automatically rename your query by adding a |
|
|
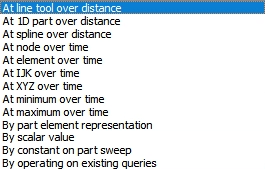
Sample |
This menu contains the types of queries that can be created. Selecting one of these changes the interface to display controls related to the type. These will be discussed individually in subsequent sub-sections.
 |
|
|
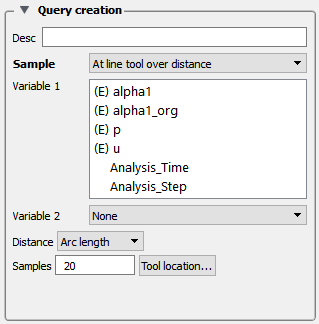
queries at uniform points along the line tool. |
||
|
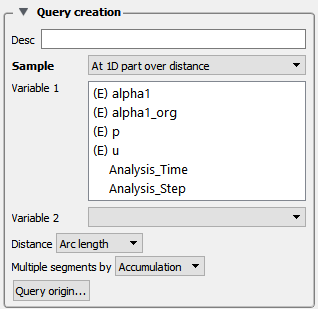
queries at the nodes of a 1D part. |
||
|
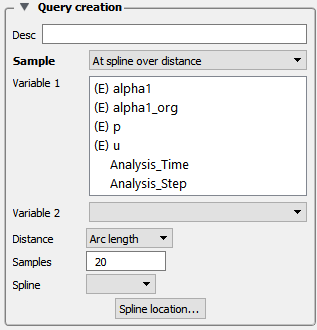
queries along an existing spline. |
||
|
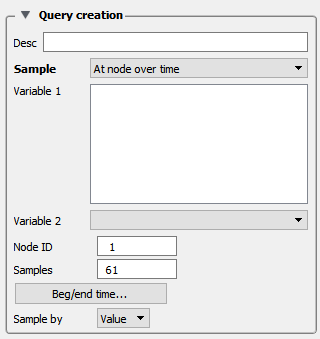
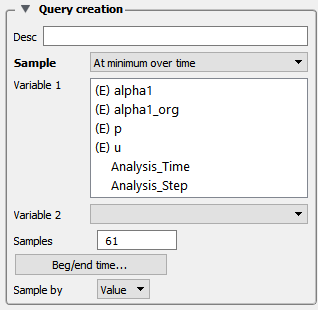
queries at a node over a range of times. |
||
|
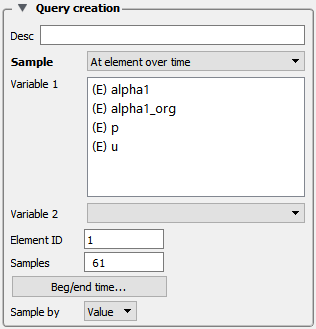
queries at an element over a range of times. |
||
|
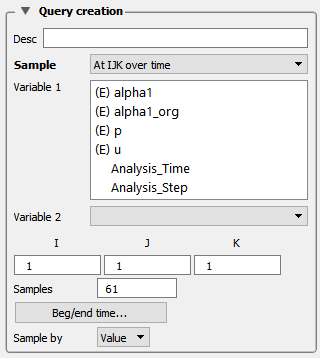
queries at an IJK location over a range of times. |
||
|
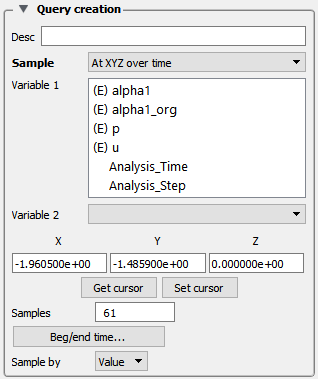
queries at the x, y, z location over a range of times. |
||
|
queries the minimum of a variable over a range of times. |
||
|
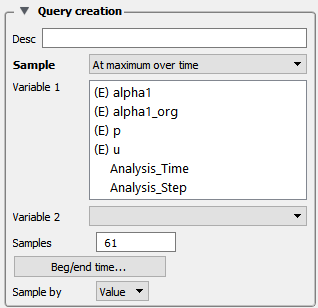
queries the maximum of a variable over a range of times. |
||
|
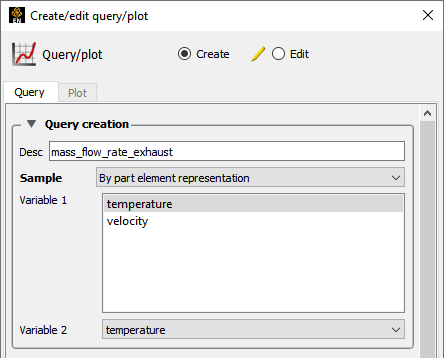
creates a scatter plot of the variables selected for the part selected. The nodal or elemental variable is queried on the element representation of the part. |
||
|
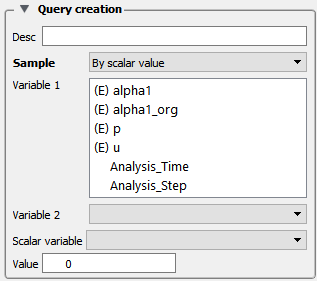
queries two variables at a given int(scalar variable value). |
||
|
queries a constant variable over the range, of the swept part. |
||
|
forms new query by scaling and/or combining existing ones. |
||
|
imports previously saved or externally generated queries. (This can be EnSight XY data format or MSC Dytran .ths files.) |
||
|
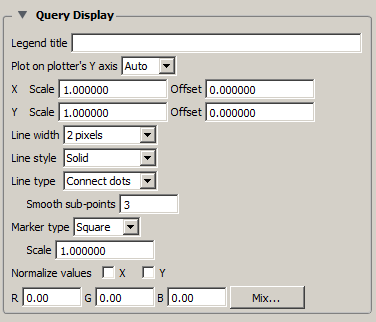
Query display |
 |
|
|
Legend title |
The title/name/description of the query legend. By default this inherits the Query Creation Desc(ription). This text field allows the query legend description to be changed. |
|
| Plot on Plotter's Y axis |
The options are:
|
|
|
X/Y Scale |
Scale factor for query values in X and or Y |
|
|
X/Y Offset |
Offset for query values in X and or Y |
|
|
Line width |
Line width for the query. |
|
|
Line style |
Line style for the query, solid, dotted, or dashed. |
|
|
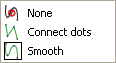
Line type |
Line type for the query, none, connect the dots, or smooth. |
|
|
Smooth sub-points |
When line type is smooth, this controls the smoothness. |
|
|
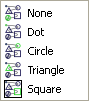
Marker type |
The type of the marker along the query. None, dot, circle, triangle, or square. |
|
|
Scale |
Scale factor for the marker. |
|
|
Normalize values X/Y |
Toggles to normalize the query values, or not. |
|
|
RGB |
Color of the query line. |
|
|
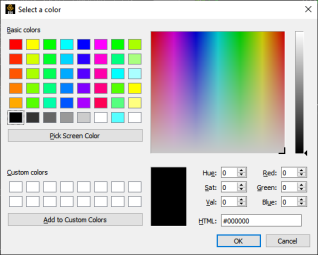
Mix... |
To use the color selector to set the color values. |
|
|
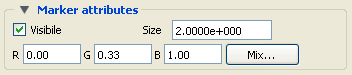
Marker attributes |
 |
|
|
Visible |
Toggles the visibility of the marker showing the location for the query. For distance queries, a sphere marker will be shown indicating the beginning location for the query. |
|
|
Size |
The size of the sphere marker. The value is a scale factor. Values larger than 1.0 will scale the marker up, while values less than 1.0 (but greater than 0.0) will scale the marker down. |
|
|
RGB |
The red, green, and blue color for the marker. |
|
|
Mix... |
Opens the Color Selector to specify the color of the marker. |
|
|
Auto Plot queries |
When toggled ON, newly created queries will automatically be plotted as well. |
|
|
Limited redraw |
When toggled ON, all plots will be shown (invisible plots show translucently and will not change). |
|
|
Create Query |
Creates the query according to the specified options and values. |
|
|
Reselect parts |
Updates the query to use the currently selected parts in the Part list. |
|
|
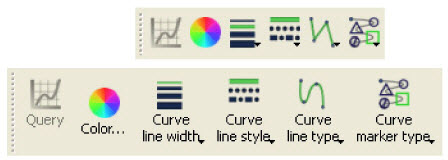
Quick Action Icons for Queries |
When a query is selected, the following Quick Action Icons are available in the tool ribbon: With and without icon labels:
 |
|
|
Color... |
Control color of selected query in color dialog that comes up.
 |
|
|
Curve line width |
Select common line widths for selected curve.
 |
|
|
Curve line style |
Select the line style for the selected curve.
 |
|
|
Curve line type |
Select the line type for the selected curve.
 |
|
|
Curve marker type |
Select the marker type for the selected curve.
 |
|
|
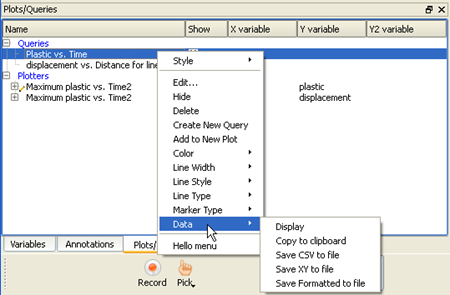
Right-click options for Queries |
Several things can be accomplished by right-clicking on a query in the Plots/Queries panel. Many of them are duplicates of what can be done in other ways. But a couple of them are worth noting here.
 |
|
|
Data |
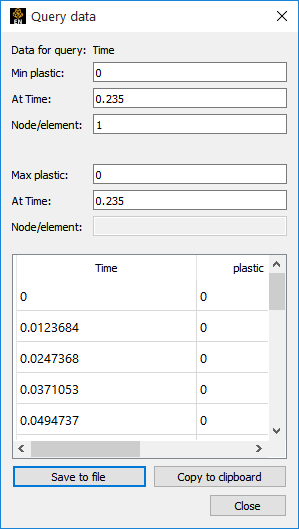
Display |
This will display the results (including the min and max values) of the selected query in a window.
 |
|
|
Will copy the query data to the clipboard. (Same as hitting the button under Display). |
|
|
Save CSV to File |
Opens the File Selection dialog for specification of filename to save as a .csv file. |
|
|
Save XY to File |
Opens the File Selection dialog for specification of filename to save in a generic format which could be used to export the information to a different plotting system. |
|
|
Save Formatted to File |
Opens the File Selection dialog for specification of filename to save in the same format as the Display option shows. |
|
|
Variable: 1 |
A list of variables that can be chosen for the query. Choose one variable. If plotted, this variable will be plotted along the Y-Axis. |
|
|
Variable: 2 |
If you leave this blank, DISTANCE will be the default X- Axis variable. If you choose a variable from the list, a scatter plot query will result, and the X-Axis will be the variable you have chosen. |
|
|
Distance |
A menu of choices that control the distance parameter. |
|
|
Arc Length |
The distance along the part from the first node to each subsequent node (i.e. the sum of the 1D element lengths). |
|
|
X Arc Length |
The X coordinate value of each node accumulated from the start. |
|
|
Y Arc Length |
The Y coordinate value of each node accumulated from the start |
|
|
Z Arc Length |
The Z coordinate value of each node accumulated from the start. |
|
|
From Origin |
The distance from the origin. |
|
|
X from Origin |
The X distance from the origin. |
|
|
Y from Origin |
The Y distance from the origin. |
|
|
Z from Origin |
The Z distance from the origin. |
|
|
Samples |
For queries over Distance using the Line Tool, this field specifies the number of equally spaced points to query along the line. |
|
|
Tool Location... |
Brings up the Transformation Editor (Line Tool) dialog for feedback and manipulation of the location of the line tool. |
|
Note: The 1D part to use for the query must be selected from the Part's list. The query of the chosen variable will be created starting at the 1D part origin (or the lowest node ID number, or the first node in the connectivity list) and will automatically proceed by following the connectivity order. The order of the query cannot be changed, but it can be reversed in the plotter, if desired.
|
Variable: 1 |
A list of variables that can be chosen for the query. Choose one variable. If plotted, this variable will be plotted along the Y-Axis. |
|
|
Variable: 2 |
If you leave this blank, DISTANCE will be the default X- Axis variable. If you choose a variable form the list, a scatter plot query will result, and the X-Axis will be the variable you have chosen. |
|
|
Distance |
A menu of choices that control the distance parameter. |
|
|
Arc Length |
The distance along the part from the first node to each subsequent node (i.e. the sum of the 1D element lengths). |
|
|
X Arc Length |
The X coordinate value of each node accumulated from the start. |
|
|
Y Arc Length |
The Y coordinate value of each node accumulated from the start |
|
|
Z Arc Length |
The Z coordinate value of each node accumulated from the start. |
|
|
From Origin |
The distance from the origin. |
|
|
X from Origin |
The X distance from the origin. |
|
|
Y from Origin |
The Y distance from the origin. |
|
|
Z from Origin |
The Z distance from the origin. |
|
|
Multiple segments by |
When the selected 1D part contains more than one contiguous segment, these are handled by: |
|
|
Accumulation |
Each segment's query is appended to the previous. Therefore a plot of this query will be one extended curve, but the extents of individual segment may not be obvious. |
|
|
Reset Each |
Each segment's query is treated like it is independent. Therefore a plot of this query will appear as several curves. |
|
|
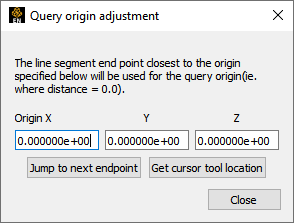
Query Origin... |
Brings up the Query Origin Adjustment dialog for feedback and manipulation of the location of the query origin.
|
|
|
Orig XYZ |
Coordinates of the location to use for query origin determination. The endpoint closest to the origin specified will be used as the origin of the query, that is, where distance is zero. If the 1D part is s closed loop (i.e. there are no end points), the closest point on the loop is used as the "origin". |
|
|
Jump To Next Endpoint |
When multiple segments are present, clicking this button jumps to the beginning of the next segment, placing that location in to the Orig XYZ fields. |
|
|
Get Cursor Tool Location |
Places the current cursor tool location into the Orig XYZ fields so that point can be used as the query origin. |
|
Note: The 1D part to use for the query must be selected from the Part's list.
|
Variable: 1 |
A list of variables that can be chosen for the query. Choose one variable. If plotted, this variable will be plotted along the Y-Axis. |
|
|
Variable: 2 |
If you leave this blank, DISTANCE will be the default X- Axis variable. If you choose a variable form the list, a scatter plot query will result, and the X-Axis will be the variable you have chosen. |
|
|
Distance |
A menu of choices that control the distance parameter. |
|
|
Arc Length |
The distance along the part from the first node to each subsequent node (i.e. the sum of the 1D element lengths). |
|
|
X Arc Length |
The X coordinate value of each node accumulated from the start. |
|
|
Y Arc Length |
The Y coordinate value of each node accumulated from the start |
|
|
Z Arc Length |
The Z coordinate value of each node accumulated from the start. |
|
|
From Origin |
The distance from the origin. |
|
|
X from Origin |
The X distance from the origin. |
|
|
Y from Origin |
The Y distance from the origin. |
|
|
Z from Origin |
The Z distance from the origin. |
|
|
Spline, |
Pick a Spline. |
|
|
Spline location... |
This will pop up the Transformation Editor for Splines. See Use the Spline Tool for more information on Spline Tools. |
|
|
Variable: 1 |
A list of variables that can be chosen for the query. Pick one variable. If plotted, this variable will be plotted along the Y-Axis. |
|
|
Variable: 2 |
If you leave this blank, TIME will be the default X- Axis variable. If you choose a variable form the list, a "scatter plot" query will result, and the X-Axis will be the variable you have chosen. |
|
|
Samples |
Specifies how many evenly timed moments over the specified range of time steps at which to query (if left blank, you get a sample point at each time step). If you specify more or fewer sample points than the number of time steps, EnSight linearly interpolates between the adjoining time steps. If query is an FFT sampling, the number of frequencies output will be less than or equal to the number of sample points. |
|
|
Node ID |
Specifies a node ID. |
|
|
Beg/End Time... |
Informs you that Begin/End time can be set in the solution time player panel. |
|
|
Sample By |
Opens a pop-up menu for specification of how to report values for Over Time queries. Options are: |
|
|
Value |
reports values versus time. |
|
|
FFT |
reports FFT spectral values versus FFT positive frequencies. |
|
|
Variable: 1 |
A list of variables that can be chosen for the query. If plotted, this variable will be plotted along the Y-Axis. Note: Only |
|
|
Variable: 2 |
If you leave this blank, TIME will be the default X- Axis variable. If you choose a variable form the list, a scatter plot query will result, and the X-Axis will be the variable you have chosen. |
|
|
Samples |
Specifies how many evenly timed moments over the specified range of time steps at which to query (if left blank, you get a sample point at each time step). If you specify more or fewer sample points than the number of time steps, EnSight linearly interpolates between the adjoining time steps. If query is an FFT sampling, the number of frequencies output will be less than or equal to the number of sample points. |
|
|
Element ID |
Specifies an element ID. |
|
|
Beg/End Time... |
Informs you that Begin/End time can be set in the solution time player panel. |
|
|
Sample By |
Opens a pop-up menu for specification of how to report values for Over Time queries. Options are: |
|
|
Value |
reports values versus time. |
|
|
FFT |
reports FFT spectral values versus FFT positive frequencies. |
|
|
Variable: 1 |
A list of variables that can be chosen for the query. If plotted, this variable will be plotted along the Y-Axis. |
|
|
Variable: 2 |
If you leave this blank, TIME will be the default X- Axis variable. If you choose a variable form the list, a scatter plot query will result, and the X-Axis will be the variable you have chosen. |
|
|
Samples |
Specifies how many evenly timed moments over the specified range of time steps at which to query (if left blank, you get a sample point at each time step). If you specify more or fewer sample points than the number of time steps, EnSight linearly interpolates between the adjoining time steps. If query is an FFT sampling, the number of frequencies output will be less than or equal to the number of sample points. |
|
|
IJK |
Specifies the IJK planes of the desired location. |
|
|
Beg/End Time... |
Informs you that Begin/End time can be set in the solution time player panel |
|
|
Sample By |
Opens a pop-up menu for specification of how to report values for Over Time queries. Options are: |
|
|
Value |
reports values versus time. |
|
|
FFT |
reports FFT spectral values versus FFT positive frequencies. |
|
|
Variable: 1 |
A list of variables that can be chosen for the query. Choose one variable. If plotted, this variable will be plotted along the Y-Axis. |
|
|
Variable: 2 |
If you leave this blank, TIME will be the default X- Axis variable. If you choose a variable form the list, a scatter plot query will result, and the X-Axis will be the variable you have chosen. |
|
|
Samples |
Specifies how many evenly timed moments over the specified range of time steps at which to query (if left blank, you get a sample point at each time step). If you specify more or fewer sample points than the number of time steps, EnSight linearly interpolates between the adjoining time steps. If query is an FFT sampling, the number of frequencies output will be less than or equal to the number of sample points. |
|
|
Get/Set cursor |
Get will put the current coordinates of the cursor tool into the x, y and z fields. Set will open up the Transformation Editor (Cursor Tool) dialog for specification of the cursor location. You can of course also set this location using interactive or picking methods. |
|
|
Beg/End Time... |
Informs you that Begin/End time can be set in the solution time player panel |
|
|
Sample By |
Opens a pop-up menu for specification of how to report values for Over Time queries. Options are: |
|
|
Value |
reports values versus time. |
|
|
FFT |
reports FFT spectral values versus FFT positive frequencies. |
|
|
Variable: 1 |
A list of variables that can be chosen for the query. If plotted, this variable will be plotted along the Y-Axis. Note: You can choose more than one variable in the list which is a time-saving feature producing multiple queries at once as EnSight marches through time. |
|
|
Variable: 2 |
If you leave this blank, TIME will be the default X- Axis variable. If you choose a variable form the list, a scatter plot query will result, and the X-Axis will be the variable you have chosen. |
|
|
Samples |
Specifies how many evenly timed moments over the specified range of time steps at which to query (if left blank, you get a sample point at each time step). If you specify more or fewer sample points than the number of time steps, EnSight linearly interpolates between the adjoining time steps. If query is an FFT sampling, the number of frequencies output will be less than or equal to the number of sample points. |
|
|
Beg/End Time... |
Informs you that Begin/End time can be set in the solution time player panel |
|
|
Sample By |
Opens a pop-up menu for specification of how to report values for Over Time queries. Options are: |
|
|
Value |
reports values versus time. |
|
|
FFT |
reports FFT spectral values versus FFT positive frequencies. |
|
|
Variable: 1 |
A list of variables that can be chosen for the query. If plotted, this variable will be plotted along the Y-Axis. You can choose more than one variable in the list which is a time-saving feature producing multiple queries at once as EnSight marches through time. |
|
|
Variable: 2 |
If you leave this as blank, TIME will be the default X- Axis variable. If you choose a variable form the list, a scatter plot query will result, and the X-Axis will be the variable you have chosen. |
|
|
Samples |
Specifies how many evenly timed moments over the specified range of time steps at which to query (if left blank, you get a sample point at each time step). If you specify more or fewer sample points than the number of time steps, EnSight linearly interpolates between the adjoining time steps. If query is an FFT sampling, the number of frequencies output will be less than or equal to the number of sample points. |
|
|
Beg/End Time... |
Informs you that Begin/End time can be set in the solution time player panel |
|
|
Sample By |
Opens a pop-up menu for specification of how to report values for Over Time queries. Options are: |
|
|
Value |
reports values versus time. |
|
|
FFT |
reports FFT spectral values versus FFT positive frequencies. |
|
|
Variable: 1 |
A list of variables that can be shosen for the query. Chose one variable. If plotted this variable will be plotted on the Y-Axis. |
|
|
Variable: 2 |
You must choose a second variable from this list. Only the same type variable will be available, i.e., if Variable 1 is a element based variable then Variable 2 must also be a element based variable |
|
|
Variable: 1 |
A list of variables that can be chosen for the query. Choose one variable. If plotted, this variable will be plotted along the Y-Axis. This is best plotted as a scatter plot. |
|
|
Variable: 2 |
A list of variables that can be chosen for the query. If plotted, this variable will be plotted along the X-Axis. This is best plotted as a scatter plot. |
|
|
Scalar variable |
The scalar variable to use. |
|
|
Value |
The value of the Scalar variable to use. This does an integer compare of the value you enter here to the integer of the variable. If int(value you enter) exactly equals the int(variable value) then the Variable1, Variable 2 pair is selected. For example, if you enter a Value of 0.0, then values of the Scalar variable from -0.5 to 0.5 will match. |
|
|
Variable: 1 |
A list of constant variables that can be chosen for the query. If plotted, this variable will be plotted along the Y-Axis. Note: You can choose more than one variable at a time. |
|
|
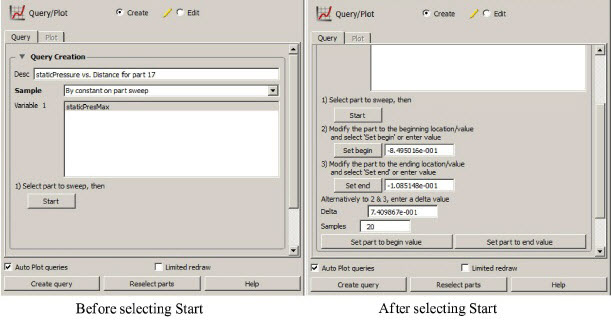
1) Select part to sweep, then [Start] |
Instructions to make sure you first select a part that has Variable 1. then clicking [Start] lists the rest of the instructions 2-3, the Delta, Samples, etc. |
|
|
2) Modify the part to the beginning location/value and select [Set begin] or enter value |
Set Begin |
Select after moving the sweep part to the beginning location |
|
- or - |
Enter the value of the beginning part location and click Enter. |
|
|
3) Modify the part to the ending location/value and select [Set end] or enter value |
Set end |
Select after moving sweep part to the ending location |
|
- or - |
Enter the value of the ending part location and click Enter. |
|
|
Alternatively to 2 & 3, enter a delta value |
Delta |
The delta value by which the part will increment(+) or decrement(-) for the number of Samples |
|
Samples |
Specifies how many evenly sampled increments over the range of the part location at which to query. The number of Samples will either proceed: |
|
|
Set parts to begin value |
Sets the parts at the begin value (useful for increment(+)) |
|
|
Set parts to end value |
Sets the parts at the end value (useful for decrement(-)) |
|
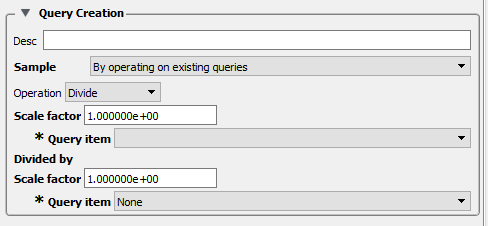
This allows you to create a new query by operating on one or two existing queries as follows. You can scale a query, add two scaled queries together (scale by -1.0 to subtract), multiply or divide two queries, and integrate/differentiate a single query.
|
Operation: Combine/Scale |
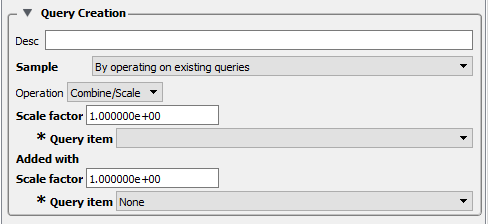 A single query can be scaled, or two queries can be algebraically added. |
|
|
Scale Factor |
Scale factor for the Query Item selected. The values of the selected query will be multiplied by this factor either before it is added to the second query or before the new query is created (if only operating on a single query). |
|
|
Query Item |
The existing query item(s) to operate on. A new query will be create consisting of scaled values one query, or the scaled, algebraic sum of two queries. |
|
|
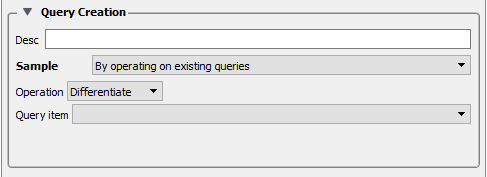
Operation: Differentiate |
Change the graphic to actually have the operation as .
 |
|
|
Query Item |
The existing query item(s) to operate on. A new query will be create consisting of the differentiated values of the chosen query. |
|
|
Operation: Divide |
One query can be divided by another.
 |
|
|
Scale Factor |
Scale factor for the Query Item selected. The values of the selected query will be multiplied by this factor before it is divided by the second query. |
|
|
Query Item |
The existing query item(s) to operate on. A new query will be create consisting of the scaled, division of two queries. |
|
|
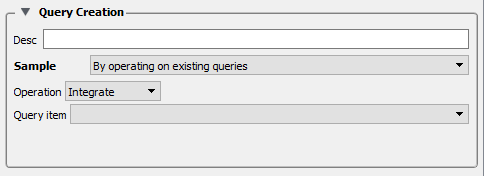
Operation: Integrate |
You can integrate an existing query using the
 |
|
|
Query Item |
The existing query item(s) to operate on. A new query will be created consisting of the integration of the values of the chosen query. |
|
|
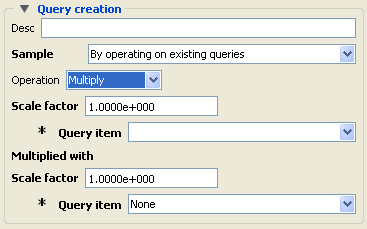
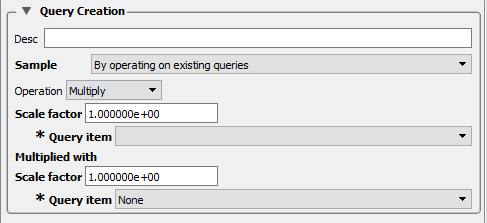
Operation: Multiply |
One query can be multiplied by another.
 |
|
|
Scale Factor |
Scale factor for the Query Item selected. The values of the selected query will be multiplied by this factor before it is multiplied by the second query. |
|
|
Query Item |
The existing query item(s) to operate on. A new query will be create consisting of the scaled, multiplication of two queries. |
|
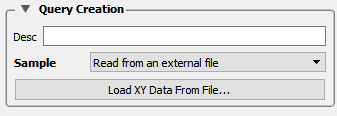
Load XY Data From File
Opens the File Selection dialog from which a previously saved or externally generated query can be retrieved. EnSight's XY data format or MSC Dytran .ths files can be read.
|
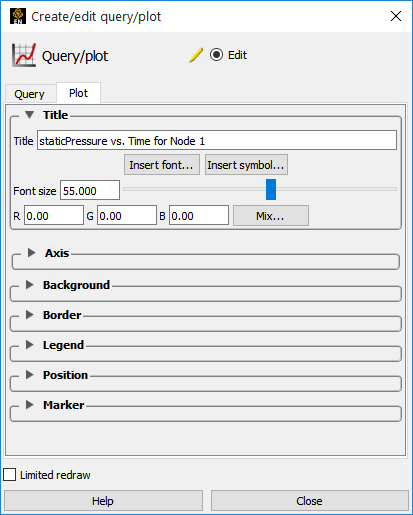
Plot Tab |
|
|
|
Title section |
||
|
Title |
This field allows you to edit the existing plotter title. | |
|
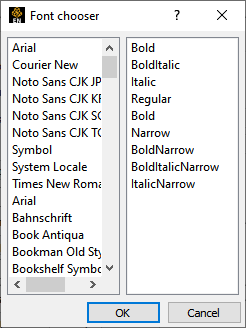
Insert Font... |
This button brings up a dialog allowing you to pick the desired font. It inserts codes into the text string at the location of the cursor.
 |
|
|
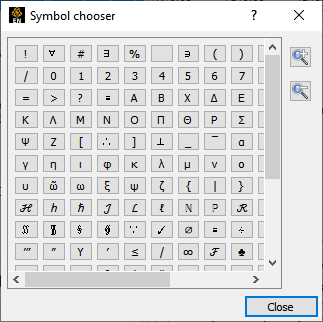
Insert Symbol... |
This button brings up a matrix of symbols
to pick from to allow you to insert symbols into the plotter title.
 |
|
|
Font Size |
This field allows you to specify the title text size. |
|
|
RGB Mix... |
Color for the Title text may be specified using either the RBG fields or the Color Selector dialog which is opened by clicking the button. |
|
|
Axis section |
||
|
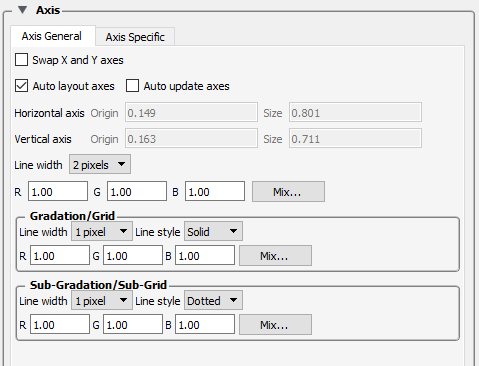
Axis General Tab |
Clicking the Axis General tab causes the dialog to configure itself for General Plotter Axis editing.
 |
|
|
Swap X and Y axes |
Toggle on to swap the x and y axes. |
|
|
Auto layout axes |
Toggle on to automatically layout the origin and size of the axes in the plotter region. |
|
|
Auto update axes |
Rescale axes when timestep is updated. This is useful as you step through time to see the plot scaled to make full use of the area, but this may be a poor choice for making a movie through time because the bounds may jump all around and obscure the interpretation of the curve(s) What you might want is fixed plot bounds, for a transient query over distance, that show your curves over all time. If this is what you want, right-click on the plot origin and choose rescale axes, which can use a small sample of timesteps (max, min and current) or all timesteps (this may take a while to step through all time) to attempt to find fixed bounds that envelop your data over all time. |
|
|
Horizontal/Vertical axis Origin and Size |
If Auto layout is not being used, you can control the origin and scale of the axes in the plotter region. Values range from 0.0 to 1.0 and resulting distances are measured from the left side (or bottom) of the Plotter. |
|
|
Both Axes |
Line Width |
A pulldown menu for the specification of the desired line width (1 to 4 Pixels) for Plotter axes. |
|
RGB Mix... |
Color for the axes may be specified using either the RBG fields or the Color Selector dialog which is opened by clicking the button. |
|
|
Gradation/Grid |
Line Width |
A pulldown menu for the specification of the desired width (1-4 Pixels) for Gradation Lines or Ticks. |
|
Line Style |
A pulldown menu for the specification of the style of line (Solid, Dotted, or Dashed) desired for gradations. (The lines are normally not visible and so this specification is only valid if Grad Type has been selected to Grid in the X-Axis and/or Y-Axis configuration of the Axis Specific Attributes dialog.) |
|
|
RGB Mix... |
Color for the Gradation Lines or Ticks may be specified using either the RBG fields or the Color Selector dialog which is opened by clicking the button. |
|
|
Sub-Gradation/Sub-Grid |
||
|
Line Width |
A pulldown menu for the specification of the desired line width (1-4 Pixels) for Sub-Gradation Lines or Ticks (those between the Gradation Lines or Ticks). |
|
|
Line Style |
A pulldown menu for the specification of the style of line (Solid, Dotted, or Dashed) desired for sub-gradations. (The lines are normally not visible and so this specification is only valid if SubG Type has been selected to Grid in the X-Axis and/or Y-Axis configuration of the Axis Specific Attributes dialog.) |
|
|
RGB Mix... |
Color for the Sub-Gradation Lines or Ticks may be specified using either the RBG fields or the Color Selector dialog which is opened by clicking the button |
|
|
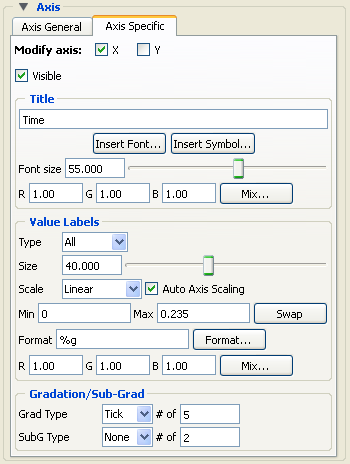
Clicking the Axis Specific Axis tab causes the dialog to configure itself for editing of Attributes specific to either the X or the Y Axis. If X-Axis toggle has been clicked, the dialog will affect the X-Axis attributes only. Likewise for Y-Axis.
 |
||
|
Visible Toggle |
Toggles on/off the visibility of the X (or Y) Axis line. |
|
|
Title |
Title |
This field allows you to edit the existing X (or Y) Axis title. |
|
Font Size |
This field allows you to specify the title text size. |
|
|
Insert Font... |
This button brings up a dialog allowing you to pick the desired font. It inserts codes into the text string at the location of the cursor.
|
|
|
Insert Symbol... |
This button brings up a matrix of symbols
to pick from to allow you to insert symbols into the plotter title.
|
|
|
RGB Mix... |
Color for the Title text may be specified using either the RBG fields or the Color Selector dialog which is opened by clicking the button. |
|
|
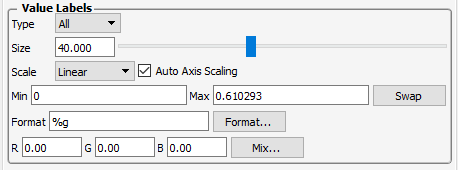
Value Labels |
|
|
|
Type |
Opens a pop-up menu for selection of desired number (None, All, or Beg/End) of X (or Y) Axis labels. |
|
|
Size |
This field allows you to specify the size of X (or Y) Axis labels |
|
|
Scale |
This field allows you to specify a linear or log10 scale for the Axis. |
|
|
Min |
This field contains the minimum value of the X (or Y) Axis. If Auto Axis Scaling is on, it is only an approximation to the value which will be used. |
|
|
Max |
This field contains the maximum value of the X (or Y) Axis. If Auto Axis Scaling is on, it is only an approximation to the value which will be used. |
|
|
Format |
This field specifies the format used to display the X (or
Y) Axis. Any C language |
|
|
Format... |
This button will open the Format dialog which allows you to select a pre-defined format. |
|
|
Gradation/Sub-Grad |
||
|
Grad Type # of |
Opens a pop-up menu for selection of desired marker (None, Grid, or Tick) for major gradations. # of field specifies the number of major gradations you wish along the X (or Y) Axis. If Auto Axis Scaling is on, it is only an approximation to the value which will be used. |
|
|
SubG Type # of |
Opens a pop-up menu for selection of desired marker (None, Grid, or Tick) for sub gradations (between the major gradations. # of field specifies the number of sub gradations you wish between each major gradation along the X (or Y) Axis. |
|
|
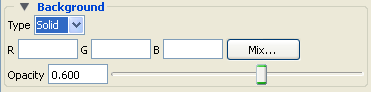
Background section |
Clicking the Background section causes the dialog to configure itself for Plotter Background editing.
 |
|
|
Type |
Opens a pop-up menu for the specification of plotter background color. Choices are:
|
|
|
RGB Mix... |
Color for the Plotter background may be specified using either the RBG fields or the Color Selector dialog which is opened by clicking the button. |
|
|
Opacity |
Field or slider to set the opacity of the background. |
|
|
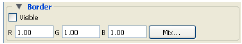
Border section |
Clicking the Border section causes the dialog to configure itself for Plotter Border editing.
 |
|
|
Visible Toggle |
Toggles on/off the visibility in the other five Modes of the Border for the selected Plotters. |
|
|
RGB Mix... |
Color for the plotter border may be specified using either the RBG fields or the Color Selector dialog which is opened by clicking the button. Note: The border color is not shown while the plotter is selected - while selected the border is shown in green. |
|
|
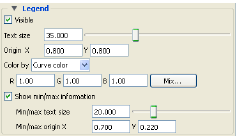
Legend section |
Clicking the Legend section causes the dialog to configure itself for Plotter Legend editing. The legend shows a line of the appropriate color, width, and marker next to the name of the curve plotted using this line style.
 |
|
|
Visible Toggle |
Toggles on/off the visibility of the legend for the selected Plotters. |
|
|
Text Size |
This field specifies the desired size of the Legend text. |
|
|
Origin X Y |
These fields specify the location of the Legend within a Plotter's border. Values range from 0.0 to 1.0 and resulting distances are measured from the Border origin (lower left corner). These fields provide an alternative to interactively positioning the plotter Legend |
|
|
Color by |
Can choose to color by the color specified for the query curve, or by specifying the color here. |
|
|
RGB Mix... |
Color for the Legend text may be specified using either the RBG fields or the Color Selector dialog which is opened by clicking the button. |
|
|
Show min/max information |
Toggle on to have min and max text information added to the plot. |
|
|
Min/max text size |
If displaying min/max information, can specify test size with the field or the slider. |
|
|
Min/max origin XY |
If displaying min/max information, can specify the xy normalized origin location. |
|
|
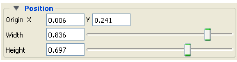
Position section |
Clicking the Position section causes the dialog to configure itself for Plotter Position.
 |
|
|
Origin X Y |
These fields specify the location of the selected Plotter within the Graphics Window. Values range from 0.0 to 1.0 and resulting distances are measured from the Graphics Window origin (lower left corner). These fields provide an alternative to interactively positioning the plotter which is done simply by clicking within the Plotter and dragging it to the desired position. |
|
|
Width, Height |
These fields specify the width and height of the Plotter. Resulting distances are measured from the Border origin (lower left corner). These fields provide an alternative to interactively resizing the plotter which is done simply by clicking on a side or corner and dragging. |
|
|
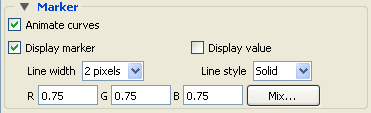
Marker section |
This section is enabled only for plots with transient data.
 |
|
|
Animate Curves |
When the solution time is changed or streamed (data loaded from disk one step after another) or loaded in the flipbook, toggling this ON will cause the transient curve to plot the data timestep by timestep. |
|
|
Display Marker |
The Marker is a vertical time indicator line that appears only on a transient plot. When the solution time is changed or streamed (data loaded from disk one step after another) or loaded in the flipbook, toggling this ON will cause the vertical line Time Marker to indicate the current timestep value on the plot. Click on the time indicator line and drag it to change the time, and the time indicator line will jump to the next time value on your plot. |
|
|
Display value |
The value at the marker can be displayed by toggling this on. |
|
|
Line Width |
Set the line width of the vertical time indicator line on the transient plot. |
|
|
Line Style |
Set the line style of the vertical time indicator line on the transient plot. |
|
|
RGB |
Set the color (RGB values) of the vertical time indicator line on the transient plot. |
|
|
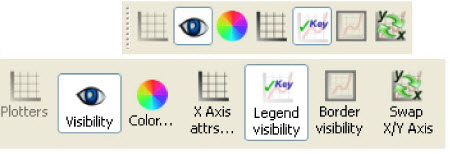
Quick Action Icons for Plots |
When a plot is selected, the following Quick Action Icons are available in the tool ribbon: With or without icon labels.
 |
|
|
Visibility |
Turn visibility of selected plot ON or OFF |
|
|
Color... |
Control color of selected plot in color dialog that comes up.
|
|
|
X Axis attrs... |
Opens the Plot Axis Specific Tab in the Feature Panel. |
|
|
Legend visibility |
Toggles the visibility of the plot legend. |
|
|
Border visibility |
Toggles the visibility of the plot border. |
|
|
Swap X/Y Axis |
Swaps the x and y axes. |
|