


In this problem, element-splitting methodologies are used during rezoning to ensure proper seal assembly behavior, including gland filling and extrusion detection. The following results are obtained at various load steps:
Figure 2.5: Deformation Profile at Load Step 1 -- Substep 20 (First Rezoning)
(a) Deformation profile at load step 1, substep 20, time = 0.4 sec, at which the first rezoning occurs
(b) Selected elements from (a) refined by splitting
(c) Close-up view of the refined region in (b), showing the element edge pivot at the corner around which the mesh must "rotate"
At the first rezoning, shown by (a) in the figure, the mesh is split around the region where the extrusion is expected to take place. The mesh topology is adjusted so that there is an edge pivot at the corner, around which the material is expected to flow into the extrusion gap (c).
A slightly larger area in (a) is selected for refinement because subsequent rezoning refinements are intended (using nesting). The larger area ensures better self contact in the notch in later stages, as shown:
Figure 2.6: Deformation Profile at Load Step 1 -- Substep 50 (Second Rezoning)
(a) Deformation profile at step 1, substep 50, at which the second rezoning occurs
(b) Selected elements from (a) refined by splitting
(c) Close-up view of the refined region in (b) showing the start of material flow into the extrusion gap about the pivot
In the absence of the edge pivot at the corner of the extrusion gap (shown by (c) in Figure 2.5: Deformation Profile at Load Step 1 -- Substep 20 (First Rezoning) and Figure 2.6: Deformation Profile at Load Step 1 -- Substep 50 (Second Rezoning) the element at that location would collapse from compression as the seal material begins to flow into the extrusion gap.
The nested element-splitting scheme gradually increases the number of degrees of freedom in the extrusion region to model the material flow in that region with increasing loads, as shown:
Figure 2.7: Deformation Profile at Load Step 2 -- Substep 10 (Third Rezoning)
(a) Deformation profile at load step 2, substep 10, at which the third rezoning occurs
(b) Selected elements from (a) refined by splitting
(c) Close-up view of the refined region in (b), showing the material flow into the extrusion gap about the pivot
As shown in (b) and (c), the nested refinement by element splitting can gradually increase the number of degrees of freedom in the region of the extrusion gap and correctly predict the material flow. The nested refinement creates a thin layer of transition elements for each block of split elements and places them far from each other, preventing the formation of badly shaped elements close to this high strain zone (which can lead to premature convergence).
After the three rezoning operations have been performed, the problem converges correctly at the end of the third load step. The following figure shows the final meshes:
Figure 2.8: Final Mesh (After Third Load Step)
(a) Final mesh after load step 3, time = 3.0 sec
(b) Close-up view of the refined region in (a), showing the extent of extrusion of the seal bead through the extrusion gap
As shown by (a) and (b), the primary objectives of the seal assembly simulation have been met:
The seal bead model is adequate to enable it to establish proper contact and fill the seal gland.
Subsequent results (shown below) quantify the extent of fluid sealing capacity and the uniformity of the contact pressures.
The seal bead model predicts the formation of an extrusion.
Depending on the seal pressure, the extrusion may or may not damage the material. The addition of extra degrees of freedom (via multiple vertical nested rezonings) allows the material enough flexibility to flow through the extrusion gap.
To determine if the seal assembly analysis predicts the extent of the seal's integrity (that is, the capacity to successfully fill the gland and develop sufficient pressure to prevent fluid leakage), the contact pressure distribution must be evaluated at the three load steps. Because the seal is molded in the metal groove in the bottom and sides, it is necessary to consider only the contact conditions on the top part of the seal.
The following figure shows the contact pressure-distribution trends at the load steps:
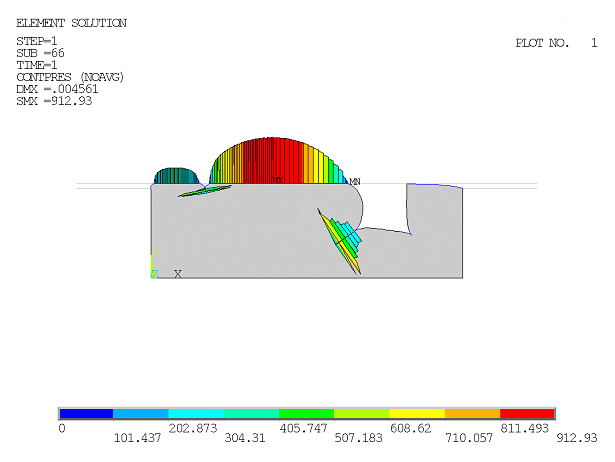
Figure 2.9: Contact Pressure-Distribution Trends
(a) Contact pressure distribution after load step 1
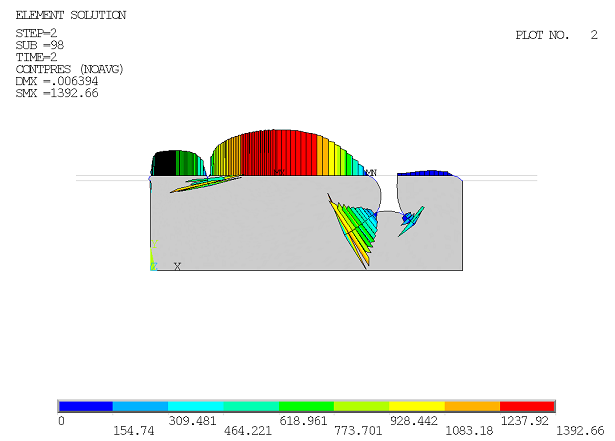
(b) Contact pressure distribution after load step 2
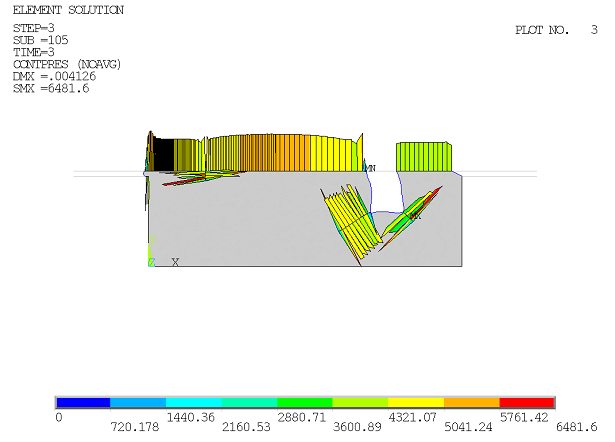
(c) Contact pressure distribution after load step 3
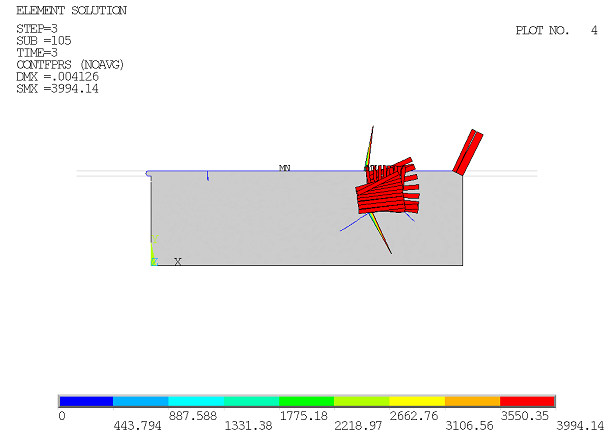
(d) Fluid pressure distribution after load step 3
As shown by (a), at the end of load step 1 (where the moving rigid mating part descends by 0.018 inches), the maximum contact pressure develops as expected at the region where the maximum geometry change occurs. The incomplete and uneven distribution of the contact pressure indicates that the seal assembly forces are not yet activated. The notch is not completely closed at this stage, providing incomplete sealing capacity.
As shown by (b), at the end of load step 2 (where the seal temperature is raised from 720 F to 3020 F), the maximum contact pressure now develops at a self-contact zone bounding the pressurization gap. The reason for this behavior is that load step 2 is a temperature load, where the temperature of the seal bead is raised uniformly by 2300 F. The uniform temperature increase expands the seal into the pressurization gap (and, to a smaller extent, the extrusion gap). As the seal expansion occurs, some pressure releases from the crown region, and contact pressure increases in the self-contact zone, as the material tries to close the pressurization gap.
Compared to load step 1 (shown by a), the contact pressures are better distributed at the rigid flexible interface between the mobile mating part and the seal bead. The notch is closed better than in load step 1, and the contact pressure of the self-contact developed in the closed notch is higher. In order to maintain seal integrity in case the rigid mating parts move during operation, it is essential that the self-contact pressures in the notch are high.
Parts (c) and (d) of the figure show the final contact pressure distribution and the corresponding fluid pressure distribution (in the pressurization gap) at the end of the third load step (fluid pressure in the pressurization gap). The action of the applied fluid pressure is to expand the pressurization gap, which in turn creates an axial (along the X axis) pressure on the seal. The axial pressure causes the maximum contact pressure to develop in the notch, thereby creating better seal integrity. The application of fluid pressure also causes a pressure differential, leading to the extrusion. Some contact pressure is created at the neck of the extrusion (which by design should not rupture the seal material). The interface pressure (as shown in (c)) indicates the contact pressure at the interface of the penetrated fluid and the solid material. The interface pressures range from 4300-4500 PSI; the pressures are greater than the applied fluid pressure of 4000 PSI, implying that the seal will not leak under the present set of loads. Downstream of the interface pressure regions, the contact pressure increases, guaranteeing the fluid-sealing capacity.
The overall contact pressure profile (at the seal-mating surface boundary) after load step 3 is more uniform than that in load steps 1 or 2 (as shown in (a) and (b)), so the seal integrity is established at this point. Local high-contact pressure peaks can cause surface damage to the seal. The evolution of the contact pressures show that local high-contact pressures have not developed except in the extrusion region.
To ensure seal bead life, the assembly and functional loads on the seal must not create large pressure differentials in the seal bead. Pressure differentials cause large shear stresses which can rupture the material, so be sure to check the hydrostatic pressure development in the seal. Unusually high hydrostatic pressures at finite deformation may also indicate volumetric locking in the element.
Figure 2.10: Seal Hydrostatic Pressures
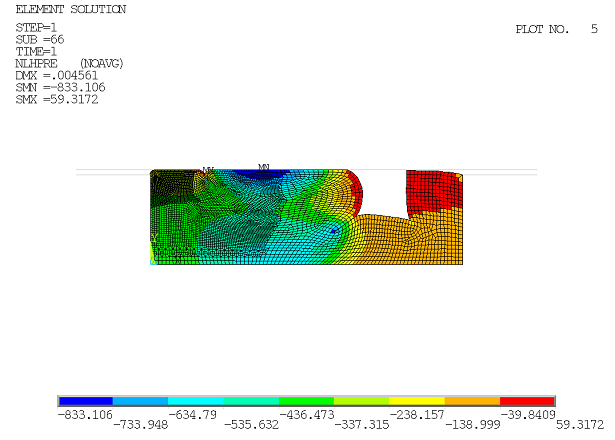
(a) Seal hydrostatic pressure after load step 1
(b) Seal hydrostatic pressure after load step 2
(c) Seal hydrostatic pressure after load step 3
As shown by (a) and (b), pressure differentials exist (especially around the notch and the pressurization gaps), indicating incomplete seal assembly. At the end of load step 3 (c), the addition of fluid pressure causes a nearly uniform pressure in the seal, except for a peak in the vicinity of the extrusion. The peak pressure near the extrusion and the free surface of the seal bead at the extrusion gap actually drives the extrusion and causes shearing strains.
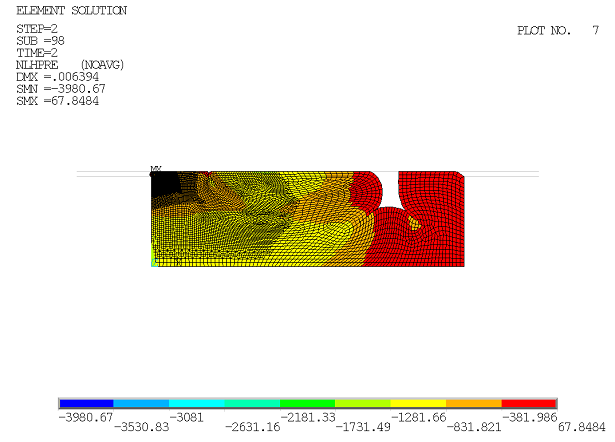
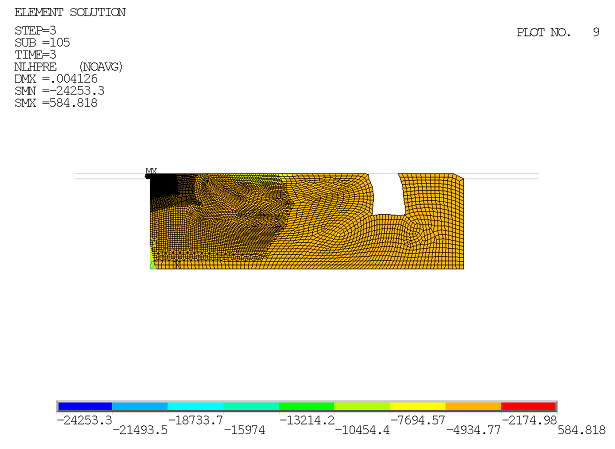
The largest assembly forces in the seal are applied vertically via the rigid mating surfaces. For optimal seal stresses, the σYY profile inside the seal must be as uniform as possible when all assembly loads have been applied. The following figure shows the σYY profile of the seal bead under the three load steps, respectively:
Figure 2.11: Seal σYY Profile
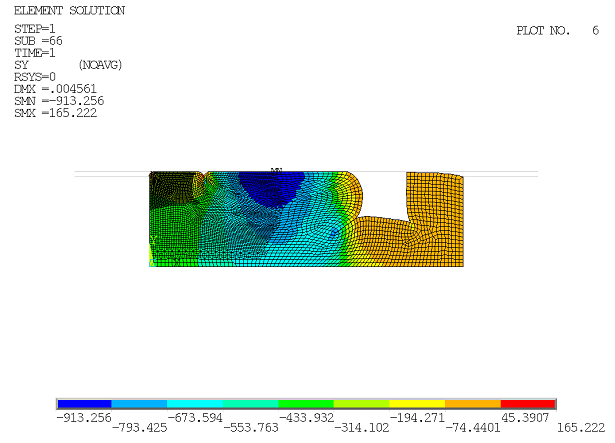
(a) σYY profile for seal at load step 1
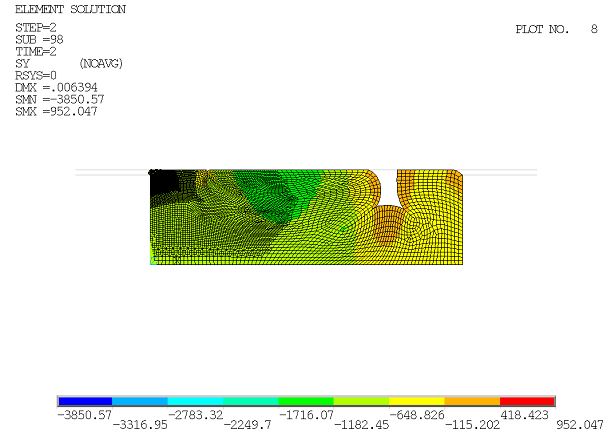
(b) σYY profile for seal at load step 2
(c) σYY profile for seal at load step 3
As shown by (a) in the figure, the maximum tensile stress occurs at the extrusion, and the maximum compression occurs at the crown region where maximum geometry change has occurred. The tensile stress occurs because the extrusion gap causes a reentrant corner to be formed at the seal (where stress concentrations may occur).
At the stage shown by (b), the temperature increase tries to expand the seal through the pressurization and the extrusion gaps, thereby moving the maximum compressive stress to a location close to the extrusion.
At (c) in the figure, fluid pressure is applied and the overall stress distribution is nearly uniform, creating near-optimal sealing conditions. Maximum tensile and compressive stresses are localized near the extrusion.
At the end of the third load step, the rigid-flexible contact pressures are near-uniform, preventing fluid leakage. The overall pressure and the σYY stresses are near-uniform in the seal bead, indicating optimal seal assembly loading.
Evidence of shearing-contact pressure spikes due to pressure differentials exists and is localized near the extrusion. This condition has been modeled adequately by the nested step-wise rezoning with element-splitting refinement used in this problem.
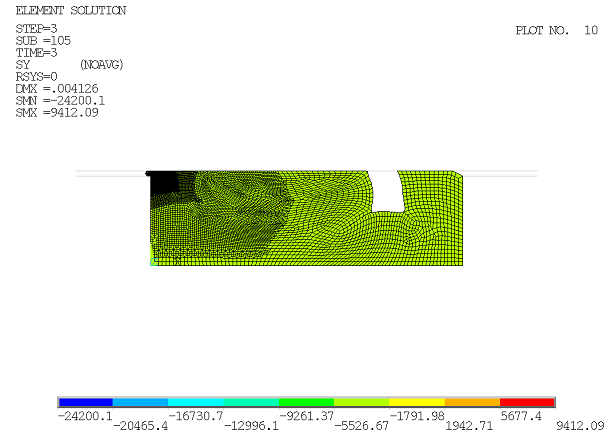
The following figure shows the σYY profile at the extrusion after the third load step:
The maximum tensile and compressive stress peaks at the end of the third load step are due to the singularity near the reentrant corner. Thus, with reference to (c) in Figure 2.10: Seal Hydrostatic Pressures, the σYY profile is virtually uniform in the seal bead.
The following figure shows the σXY profile at the extrusion after the third load step:
The maximum and minimum shearing stresses occurring at the location shown are caused by the pressure differential between the free surface of the seal bead and the seal bead itself. The shearing stress occurs as a result of the shearing strain created by the extrusion.