The modal frequencies of the NASA Rotor 67 fan blade cyclic sector model and the full model are compared in the following table:
Table 45.2: Comparison of Modal Frequencies
| Mode No. | Cyclic Sector Model (Hz) | Full 360° Model (Hz) | Error (%) |
|---|---|---|---|
| 1 | 370.17 | 370.17 | 0.00 |
| 2 | 370.17 | 370.17 | 0.00 |
| 3 | 376.70 | 376.70 | 0.00 |
| 4 | 376.70 | 376.70 | 0.00 |
| 5 | 377.12 | 377.12 | 0.00 |
| 6 | 377.12 | 377.12 | 0.00 |
| 7 | 377.41 | 377.41 | 0.00 |
| 8 | 378.93 | 378.92 | 0.00 |
| 9 | 378.93 | 378.93 | 0.00 |
| 10 | 380.42 | 380.42 | 0.00 |
| 11 | 380.42 | 380.42 | 0.00 |
| 12 | 381.65 | 381.65 | 0.00 |
| 13 | 381.65 | 381.65 | 0.00 |
| 14 | 382.65 | 382.65 | 0.00 |
| 15 | 382.65 | 382.65 | 0.00 |
The nonlinear (NLGEOM,ON) prestressed modal frequencies of the cyclic sector obtained from the linear perturbation analysis also show strong agreement with the full-model results, as shown in the following table:
Table 45.3: Comparison of Prestressed Modal Frequencies
| Mode No. | Cyclic Sector Model (Hz) | Full 360° Model (Hz) | Error (%) |
|---|---|---|---|
| 1 | 519.09 | 519.09 | 0.00 |
| 2 | 521.05 | 521.05 | 0.00 |
| 3 | 521.05 | 521.05 | 0.00 |
| 4 | 522.69 | 522.70 | 0.00 |
| 5 | 522.70 | 522.70 | 0.00 |
| 6 | 526.38 | 526.39 | 0.00 |
| 7 | 526.39 | 526.39 | 0.00 |
| 8 | 528.12 | 528.12 | 0.00 |
| 9 | 528.12 | 528.12 | 0.00 |
| 10 | 529.65 | 529.65 | 0.00 |
| 11 | 529.65 | 529.65 | 0.00 |
| 12 | 531.07 | 531.07 | 0.00 |
| 13 | 531.07 | 531.07 | 0.00 |
| 14 | 532.29 | 532.29 | 0.00 |
| 15 | 532.29 | 532.29 | 0.00 |
The prestressed modal frequencies can be plotted as a function of the number of harmonic index (nodal diameter) using the PLZZ command:
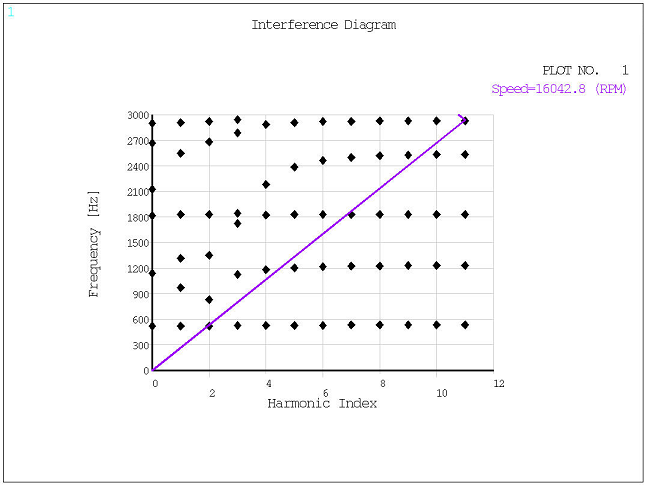
Modes dominated by blade motion tend to appear in a tight frequency range in the plot. In contrast, the modal stiffness of a disk increases rapidly as the harmonic index (nodal diameter) increases, and so disk-dominated system modes appear as slanted dotted lines in the plot. This plot is also known as a SAFE diagram or a ZZENF diagram and indicates potential frequencies where resonance may occur.
To postprocess the results of a cyclic symmetry mode-superposition harmonic analysis, you must first issue the CYCFILES command in /POST1.
For the nonlinear prestressed tuned response analysis, the following figures compare the postprocessing results of the cyclic-sector model to the full 360° model:
These results show strong agreement between the cyclic-sector model and the full 360° model. The nodal solution plots (NSOL) show the amplitude of a nodal degree-of-freedom (DOF) value with respect to the frequency of excitation:
Figure 45.18: Nodal Solution Plots with Respect to the Frequency of Excitation in the Tuned Analysis
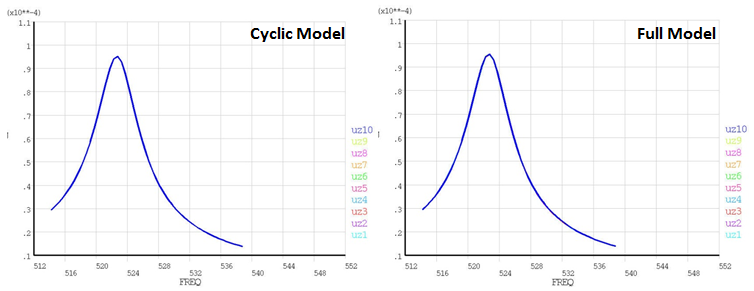
The plots indicate the occurrence of a resonance condition at 522.70 Hz. The displacement amplitude of nodes at symmetric angular positions on sectors 1 through 10 is plotted. The plots show strong agreement between the cyclic and full-model results.
You can also retrieve a maximum result value which occurs among all sectors of the model and all frequency points using CYCSPEC and CYCCALC. With these commands, you can extract tables of displacement, stress, and/or strain data for all computed harmonic solutions and for all sectors. The extracted data can be plotted using PLCFREQ and PLCHIST.
For the tuned response analysis, the maximum directional deformation at the blade tip along the Z-direction is plotted using PLCFREQ, as shown in the following figure:
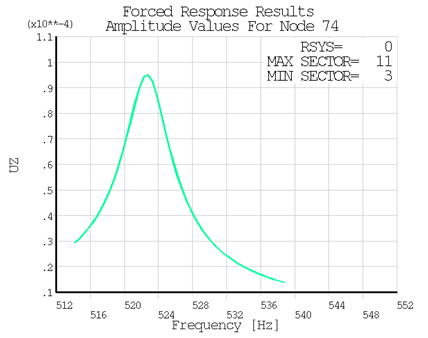
The plot clearly indicates the sector numbers which contain the maximum and minimum values for the directional deformation along the Z-direction.
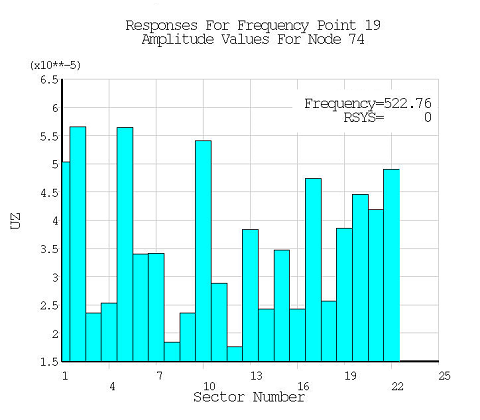
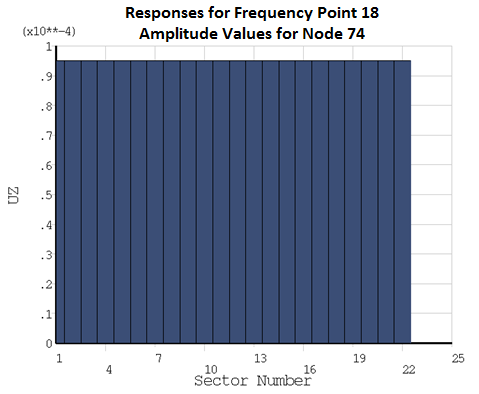
PLCHIST plots a histogram of the directional deformation along the Z-direction at the requested frequency of 522.76 Hz; one bar corresponds to one sector:
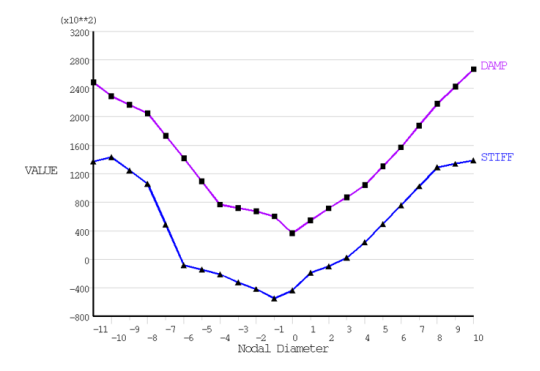
For the nonlinear prestressed mistuned response analysis with aerodamping, the following diagram shows the variation of aerodynamic stiffness and damping values as a function of nodal diameter:
The following figure shows plots of modal damping ratio versus modal frequencies obtained from the damped modal analyses (with aerodamping) of the tuned and mistuned models, respectively:
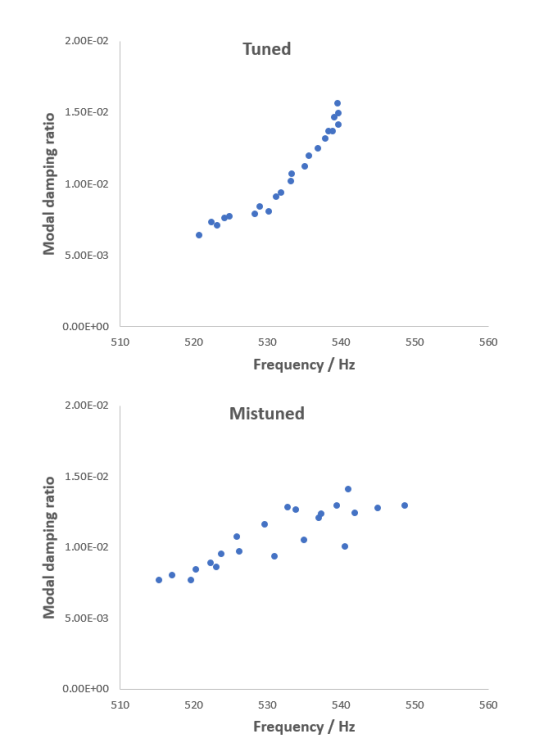
The above figure shows that the frequency range in the mistuned case has increased compared to the tuned case, while the modal damping ratio range has decreased.
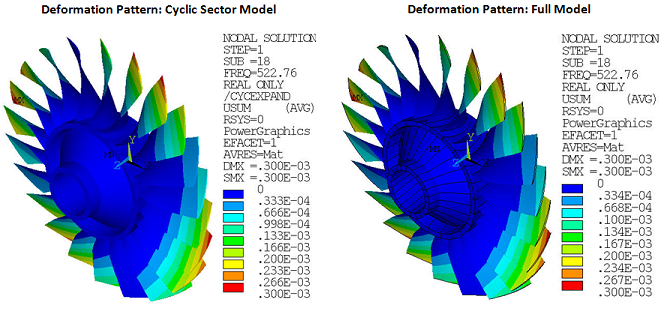
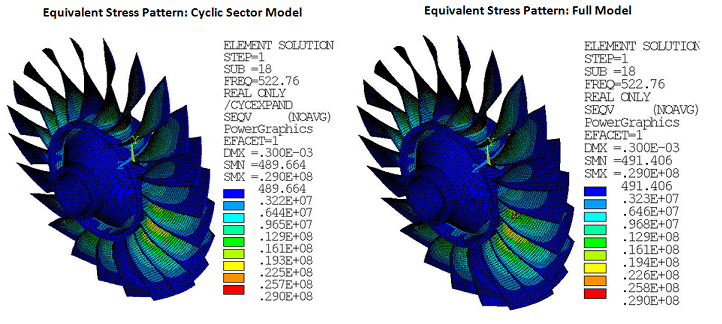
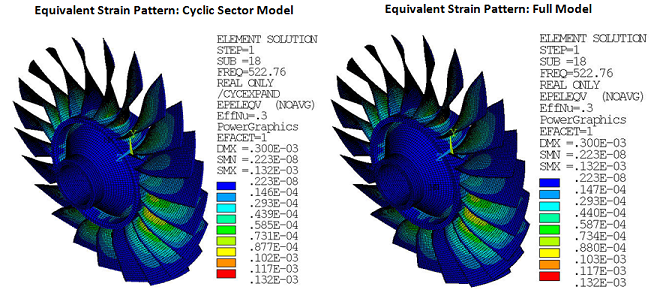
The following figures show the postprocessing (/POST1) results for the nonlinear prestressed harmonic analysis considering both aerodamping and mistuning:
Figure 45.23: Total Deformation Pattern (Real Only) at Frequency of 522.76 Hz in the Mistuned Analysis
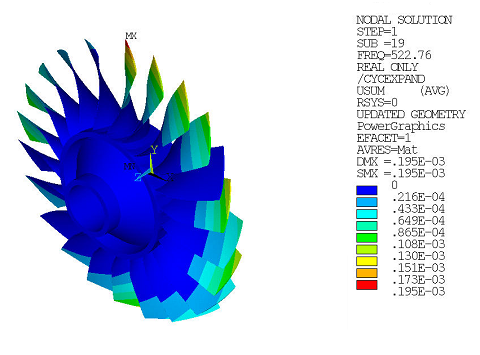
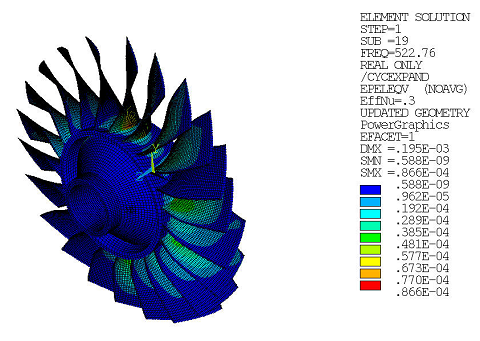
Figure 45.24: Equivalent Stress Pattern (Real Only) at Frequency of 522.76 Hz in the Mistuned Analysis
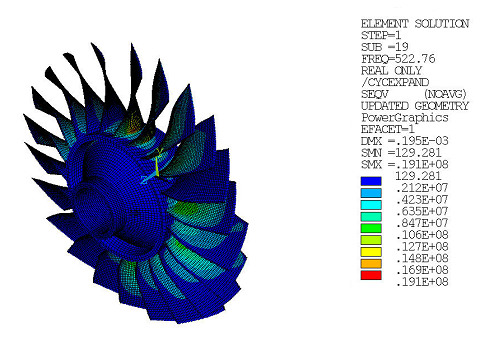
Figure 45.25: Equivalent Strain Pattern (Real Only) at Frequency of 522.76 Hz in the Mistuned Analysis
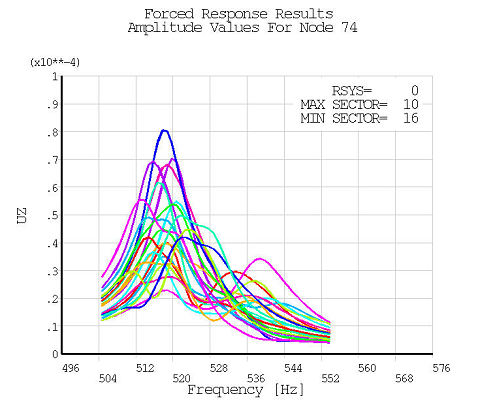
The amplitudes of a nodal degree-of-freedom (DOF) value with respect to the frequency of excitation are shown in the following nodal solution plots (NSOL):
Figure 45.26: Nodal Solution Plots with Respect to the Frequency of Excitation in the Mistuned Analysis
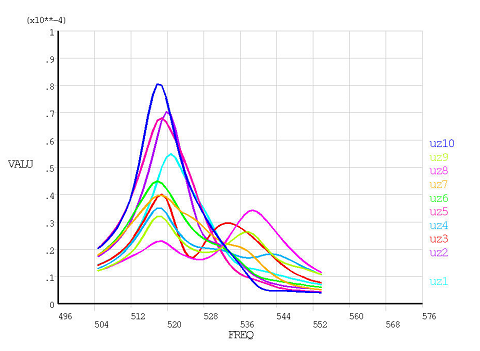
The displacement amplitude of nodes at symmetric angular positions in sectors 1 through 10 is plotted. Note that both aerodamping and mistuning effects are considered here.
The maximum directional deformation at the blade tip along the Z-direction is plotted using PLCFREQ, as shown in the following figure:
Figure 45.27: Directional Deformation at the Blade Tip Along the Z-Direction in the Mistuned Analysis
The mistuned result in Figure 45.27: Directional Deformation at the Blade Tip Along the Z-Direction in the Mistuned Analysis shows several peaks as compared to a single peak in the tuned result in Figure 45.19: Directional Deformation at the Blade Tip Along the Z-Direction in the Tuned Analysis. The sector numbers which contain the maximum and minimum values for the directional deformation along the Z-direction are indicated. The added aerodamping and mistuning also result in reduced maximum amplitude.
PLCHIST plots a histogram of the directional deformation along the Z-direction at the requested frequency of 522.76 Hz; one bar corresponds to one sector: