


The following results topics for the FSW simulation are available:
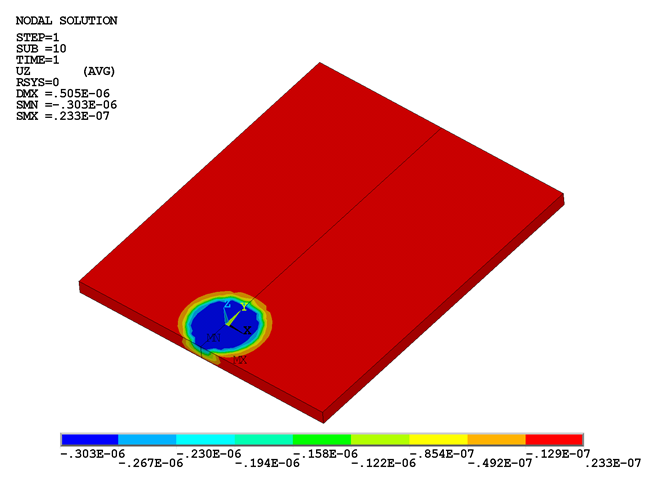
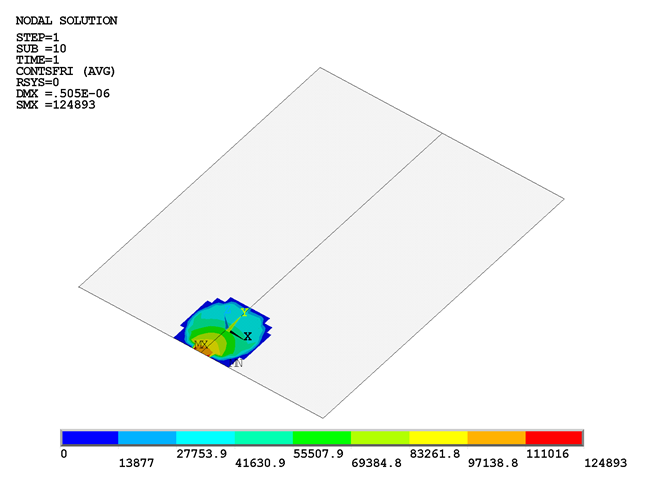
It is important to observe the change in various quantities around the weld line during the FSW process. The following figure shows the deflection of the workpiece due to plunging of the tool in the first load step:
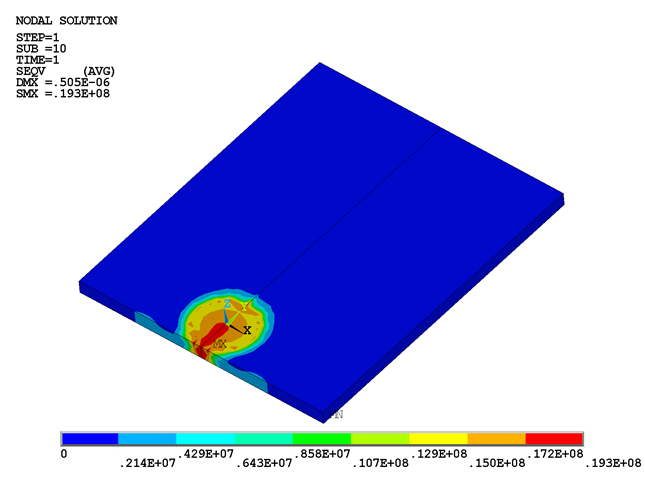
The deflection causes high stresses to develop on the workpiece beneath the tool, as shown in this figure:
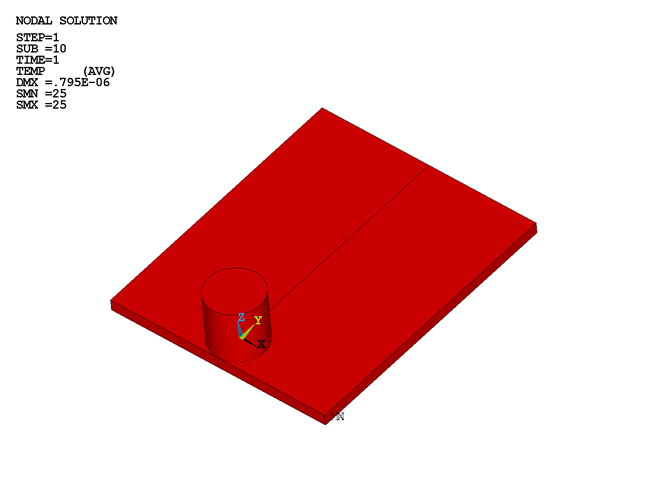
Following load step 1, the temperature remains unchanged (25 °C), as shown in this figure:
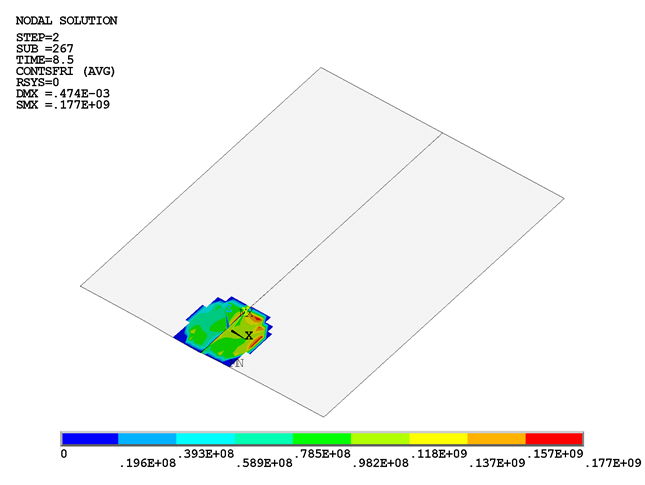
As the tool begins to rotate at this location, the frictional stresses develop and increase rapidly. The following two figures show the increment in contact frictional stresses from load step 1 to load step 2:
All frictional dissipated energy is converted into heat during load step 2. The heat is generated at the tool-workpiece interface. Most of the heat is transferred to the workpiece (FWGT is specified to 0.95). As a result, the temperature of the workpiece increases rapidly compared to that of the tool.
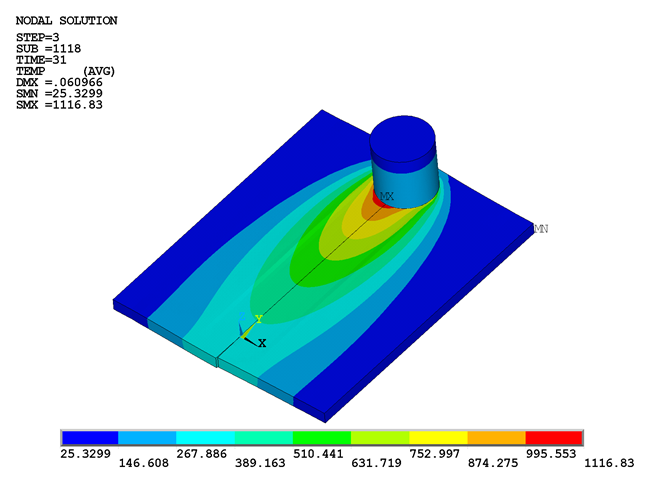
The following two figures shows the temperature rise due to heat generation in the second and third load steps:
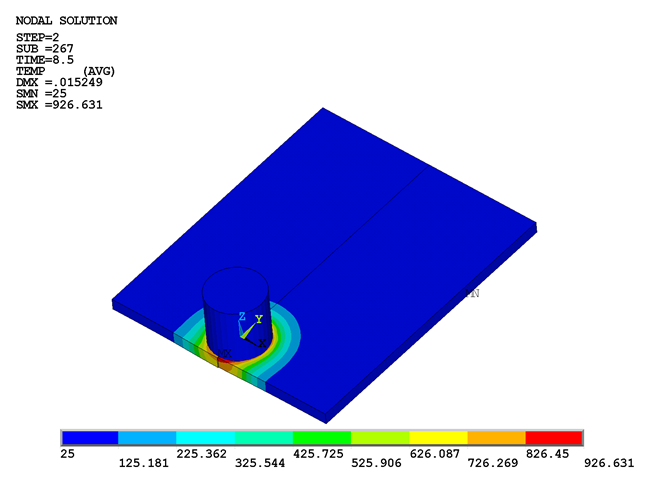
The maximum temperature on the workpiece occurs beneath the tool during the last two load steps. Heat generation is due to the mechanical loads. No external heat sources are used. As the temperature increases, the material softens and the coefficient of friction decreases. A temperature-dependent coefficient of friction (0.4 to 0.2) helps to prevent the maximum temperature from exceeding the material melting point.
The observed temperature rise in the model shows that heat generation during the second and third load steps is due to friction between the tool shoulder and workpiece, as well as plastic deformation of the workpiece material.
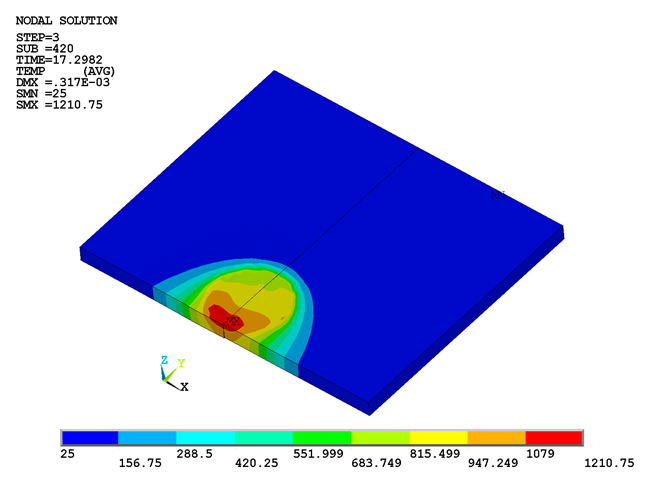
The melting temperature of 304L stainless steel is 1450 °C. As shown in the following figure, the maximum temperature range at the weld line region on the workpiece beneath the tool is well below the melting temperature of the workpiece material during the third load step, but above 70 percent of the melting temperature:
The two plates can be welded together within this temperature range.
The following figure shows the temperature distributions on the top surface of the workpiece along the transverse distance (perpendicular to the weld line):
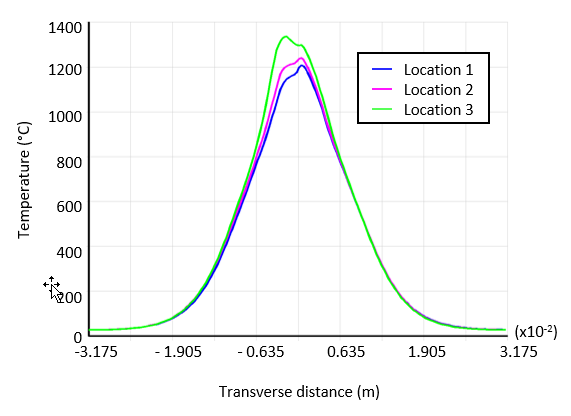
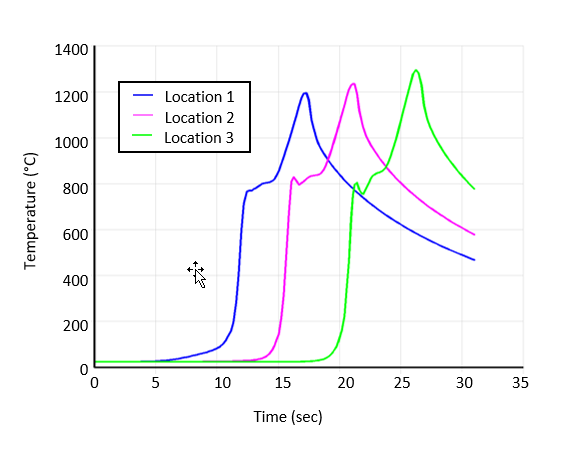
As shown in the following figure and table, the temperature plots indicate the temperature distribution at various locations on the weld line when the maximum temperature occurs at those locations:
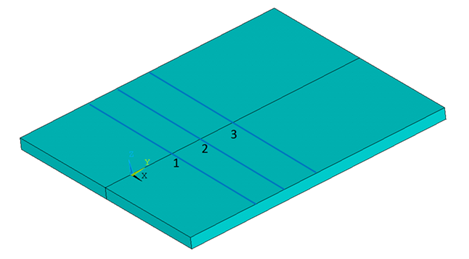
Table 28.5: Locations on Weld Line
| Location Number | Distance on the Weld Line in y Direction | Time When Maximum Temperature Occurs |
|---|---|---|
| 1 | 0.016625 m | 17.3 Sec |
| 2 | 0.027016 m | 21.2 Sec |
| 3 | 0.040871 m | 26.2 Sec |
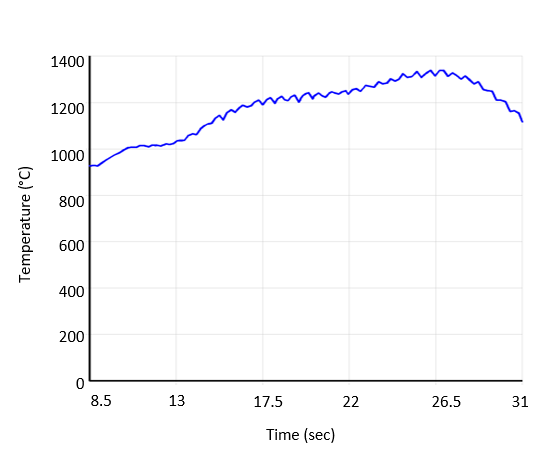
The following figure shows the temperature distribution in the thickness direction at location 1:
As expected, the highest temperature caused by heat generation appears around the weld line region. By comparing the above temperature results with the reference results, it can be determined that the temperatures obtained at the weld line are well below the melting temperature of the workpiece material, but still sufficient for friction stir welding.
A bonding temperature of 1000 °C is already defined for the welding simulation at the interface of the plates. The contact status at this interface after the last load step is shown in the following figure:
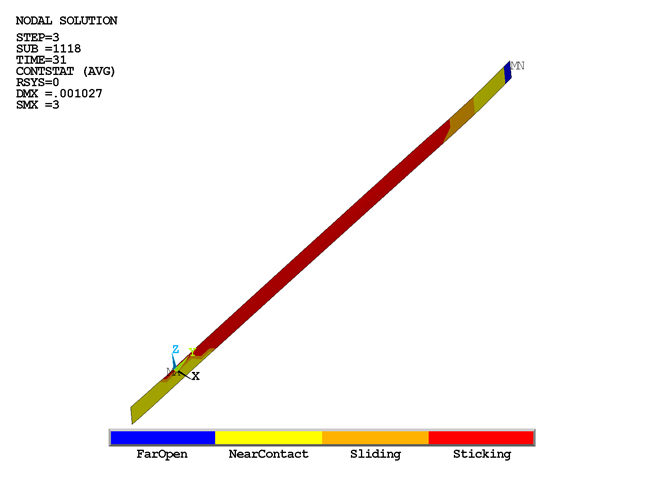
The sticking portion of the interface shows the bonding or welding region of the plates.
Friction and plastic deformation generate heat. A calculation of frictional and plastic heat generation is performed. The generation of heat due to friction begins in the second load step.
The CONTA174 element's FDDIS (SMISC item) output option is used to calculate frictional heat generation on the workpiece. This option gives the frictional energy dissipation per unit area for an element. After multiplying this value with the corresponding element area, the friction heat-generation rate for an element is calculated. By summing the values from each CONTA174 element of the workpiece, the total frictional heat generation rate is calculated for a given time.
It is possible to calculate the total frictional heat-generation rate at each time-step (ETABLE). The following figure shows the plot of total frictional heat generation rate on the workpiece with time:
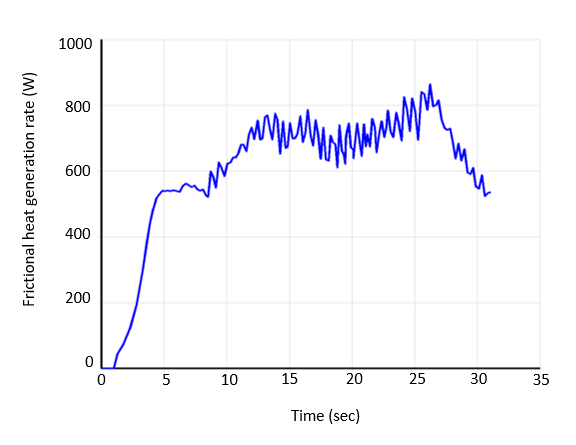
The plot indicates that the frictional heat starts from the second load step (after 1 second).
The element contact area can be calculated using the CONTA174 element CAREA (NMISC, 58) output option.
Example 28.6: Defining the Frictional Heat Calculations
/post1
set,last
*get,nst,active,,set,nset  ! To get number of data sets on result file

! Total frictional heat rate
esel,s,real,,5
esel,r,ename,,174          ! Selecting the contact elements on workpiece
*dim,fht,array,nst,1
*do,i,1,nst,1
set,,,,,,,i
etable,fri,smisc,18       ! Frictional energy dissipation per unit
                          ! area for an element, FDDIS
etable,are1,nmisc,58      ! Area of each contact element
smult,frri,fri,are1       ! Multiplying Fri. energy dissipation
                          ! per unit area with the area of
                          ! corresponding element
ssum                      ! Summing up the Frictional heat rate
*get,frhi,ssum,,item,frri ! Total Frictional heat rate on
                          ! workpiece at a particular time
fht(i,1)=frhi
*enddo
parsav,all
allsel,all
finish

/post26
file,fsw,rst
numvar,200
solu,191,ncmit            ! Solution summary data per substep to be
                          ! stored for cumulative no. of iterations.
store,merge               ! Merge data from results file
filldata,191,,,,1,1
realvar,191,191
parres,new,'fsw','parm'
vput,fht,11,,,fric_heat
plvar,11                  ! Plot of frictional heat rate against time
finish
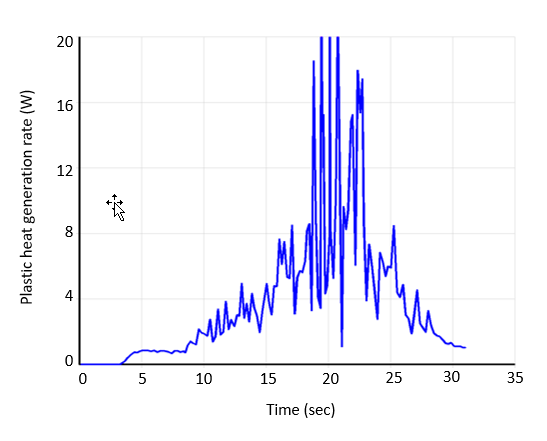
A similar calculation is performed to check the heat generation from plastic deformation on the workpiece. The SOLID226 element's output option PHEAT (NMISC, 5) gives the plastic heat generation rate per unit volume. After multiplying this value with the corresponding element volume, the plastic heat generation rate for an element is calculated. By summing the values from each element (SOLID226) of the workpiece, the total plastic heat generation rate is calculated for a particular time.
It is possible to calculate the total frictional heat generation rate at each time-step (ETABLE). The following figure shows the plot of the total plastic heat-generation rate with time.
Example 28.7: Defining the Plastic Heat Calculations
/post1
set,last
*get,nst,active,,set,nset ! To get number of data sets on result file

! Total Plastic heat rate
esel,s,mat,,1             ! Selecting the coupled elements on workpiece
etable,vlm1,volu          ! Volume of the each element
*dim,pha,array,nst,1
*do,i,1,nst,1
set,,,,,,,i
etable,pi,nmisc,5         ! Plastic heat rate per unit volume on
                          ! each element, PHEAT
smult,psi,pi,vlm1         ! Multiplying Pl. heat rate per unit
                          ! volume with the volume of
                          ! corresponding element
ssum                      ! Summing up the Plastic heat rate
*get,ppi,ssum,,item,psi   ! Total Plastic heat rate on workpiece
                          ! at a particular time
pha(i,1)=ppi
*enddo
parsav,all
allsel,all

/post26
file,fsw,rst
numvar,200
solu,191,ncmit          ! solution summary data per substep to be
                        ! stored for cumulative no. of iterations.
store,merge             ! Merge data from results file
filldata,191,,,,1,1
realvar,191,191
parres,new,'fsw','parm'
vput,pha,10,,,pheat_nmisc
plvar,10                ! Plot of Plastic heat rate against time
finish
Figure 28.22: Total Frictional Heat Rate Variation with Time and Figure 28.23: Total Plastic Heat Rate Variation with Time show that friction is responsible for generating most of the heat needed, while the contribution of heat due to plastic deformation is less significant. Because the tool-penetration is shallow and the tool pin is ignored, the plastic heat is small compared to frictional heat.