


The following topics are available:
A center-crack-tension (CCT) specimen subjected to cyclic pressure loading on the crack surfaces is analyzed using the SMART fatigue crack-growth framework. The fatigue crack-growth simulation is based on Paris' law. The numerical results from the SMART solution are compared with the reference solution.
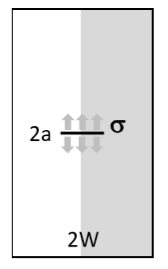
The geometrical dimensions are:
| a (half-crack length) = 8 mm |
| W (half-specimen width) = 25 mm |
| D (half-specimen depth) = 5 mm |
The specimen height is set sufficiently large so that it does not affect stress at the crack front.
An isotropic elastic material is used:
| E = 200000 N / mm2 |
| ν = 0.3 |
where E is the Young’s modulus and ν is Poisson’s ratio.
The Paris' law[3] for the fatigue crack-growth prediction is expressed as:

where N is number of cycles, K is the stress-intensity factor, and C and m are Paris' law constants.
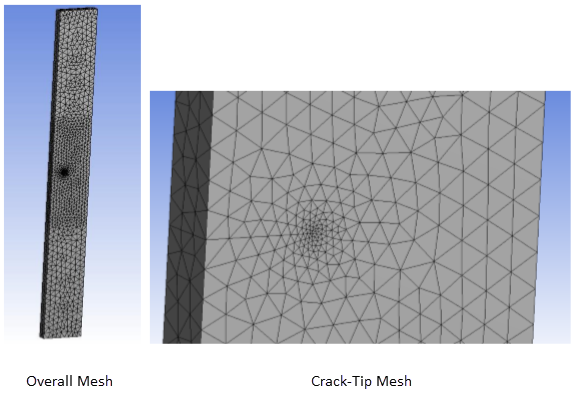
The SMART method requires that the full crack be modeled. To take advantage of the symmetric boundary conditions, a half-geometry model is created (as shown by the gray area in Figure 1: Schematic of a CCT Specimen. The model is created in Ansys Mechanical using the SOLID187 3D 10-node tetrahedral structural solid. An arbitrary crack is generated.
Two meshes with different crack-tip element sizes and mesh-sizing controls are analyzed. Model 1 has a crack-tip element size of 0.008 W, a relatively coarse mesh with 9810 elements. Model 2 has a much finer mesh with a crack-tip element size of 0.004 W and overall body-mesh sizing of 0.012 W.
Table 1: Finite Element Model Sizes
| Finite Element Model | Model 1 | Model 2 |
|---|---|---|
| Number of elements | 9810 | 31870 |
| Number of nodes | 14389 | 48424 |
| Crack-tip element size | 0.008 W | 0.004 W |
| Body sizing | None | 0.012 W |
A surface pressure of σ = 50 N / mm2 is applied to the crack surfaces. The same magnitude of surface pressure is also applied to the new crack surfaces when the crack begins to grow.
For easy comparison with the reference solution, the front and back surfaces of the specimen in the through-thickness direction are constrained to ensure a plane-strain boundary condition.
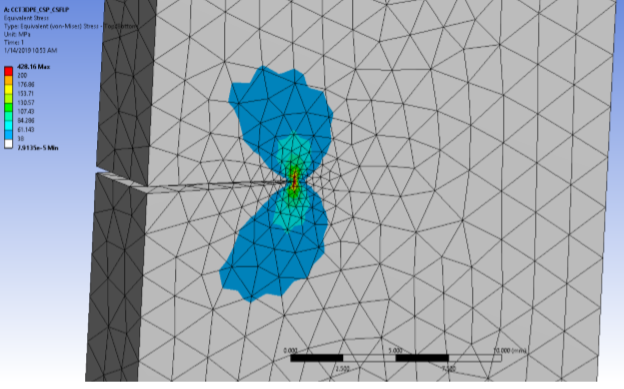
When crack-growth begins, meshes related to the crack surfaces, and the front and back surfaces inside the remeshing zone, change. SMART updates the boundary conditions automatically, including pressure load and displacement constraints, to ensure that the boundary conditions are applied correctly.
The crack is sunder pure Mode I loading. The stress-intensity-factor range is therefore:

A stress ratio of zero, R = 0.0, is assumed. The Paris' law constants are C = 1.43E-11 and m = 2.75.
The solution units are based on MKS (mm, MPa).
The finite element analyses are conducted using Ansys Mechanical release 2019 R1.
The reference solution[4] for the stress-intensity factor of a CCT specimen is based on:

where:

The reference solution is used to calculate the stress-intensity factor for fatigue crack-growth. The stress-intensity-factor range is:

Assuming that each crack-growth step is 0.1 mm, the number of cycle increments is then calculated based on Paris' law as:

and the number of accumulated cycles is:

The results obtained are used as reference solutions to compare with the numerical results from the SMART solutions:
|
Comparison: FE Predictions vs. Reference Solution | |||
|---|---|---|---|
| Model 1 | Model 2 | Reference | |
| 5 mm Crack Extension | |||
| Accumulated cycles | 47881 | 47650 | 46589 |
| Stress-intensity-factor range | 380.85 | 382.03 | 385.29 |
| 10 mm Crack Extension | |||
| Accumulated cycles | 65356 | 64940 | 63157 |
| Stress-intensity-factor range | 561.52 | 571.47 | 578.04 |
The program uses linear interpolation to obtain the SMART results of the number of accumulated cycles and the stress-intensity factor at exact crack extensions of 5 mm and 10 mm.
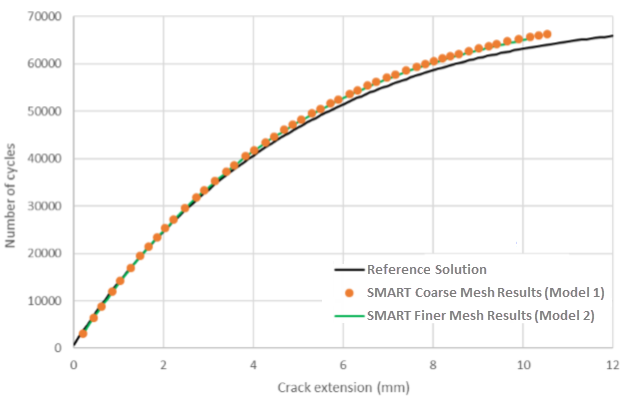
Figure 5: Comparison: Effective Stress-Intensity-Factor Range vs. Crack Extension -- Reference and SMART Solutions
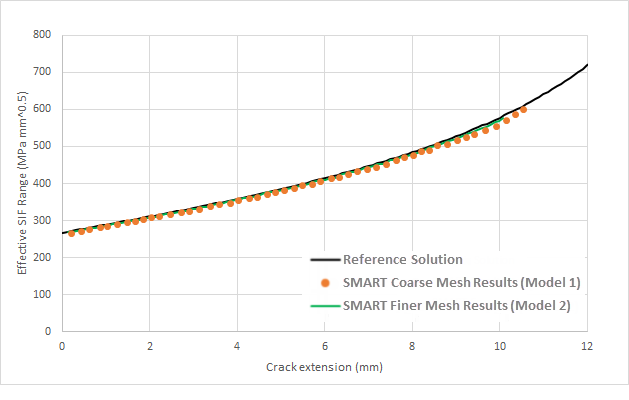
The SMART solution closely matches the reference solution. When compared to the reference results, the maximum error is approximately 3.4 percent for the accumulated-cycles prediction for the coarse-mesh Model I analysis. The results of the finer-mesh Model 2 analysis are even closer to the reference solution with all errors well within 3 percent.
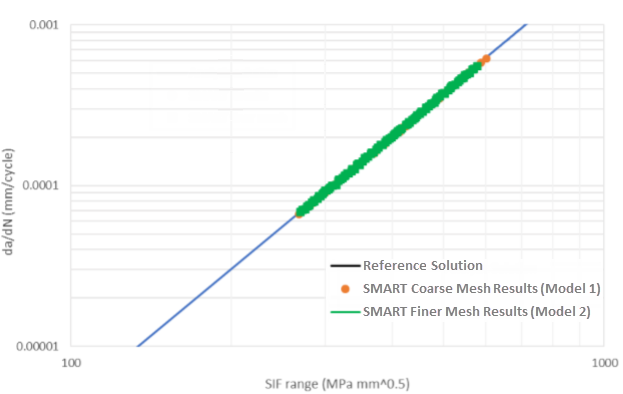
Finally, the following figure plots the reference and SMART solutions logarithmically, indicating that the SMART solutions strictly comply with Paris' law:
The following references are cited in this benchmark:
The following files are available for running this benchmark in Ansys Mechanical (.wbpz) and Mechanical APDL (.dat):