This procedure shows how to set the color of the time-frequency
representation using the Color Scale. The time-frequency representation is a graph in 3
dimensions, also known as a Colormap. The first dimension of this graph
is time, the second dimension is frequency and the third dimension is color.
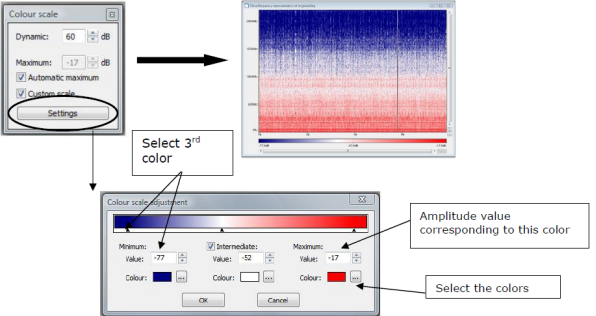
Note: Color, the third dimension can be set by using the Color scale settings. The
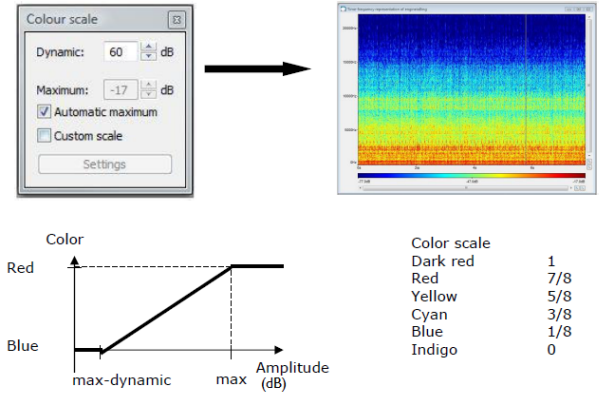
Color scale associates each amplitude in decibels of a time-frequency representation with a
color scale. The amplitudes higher than or equal to the maximum value in dB are displayed in dark red. The amplitudes below or equal to
the minimum value in dB are displayed in dark blue.


 to display the Colour scale adjustment dialog box.
 to change the color for the minimum values in dB.