Visualizing Segmented Ranking
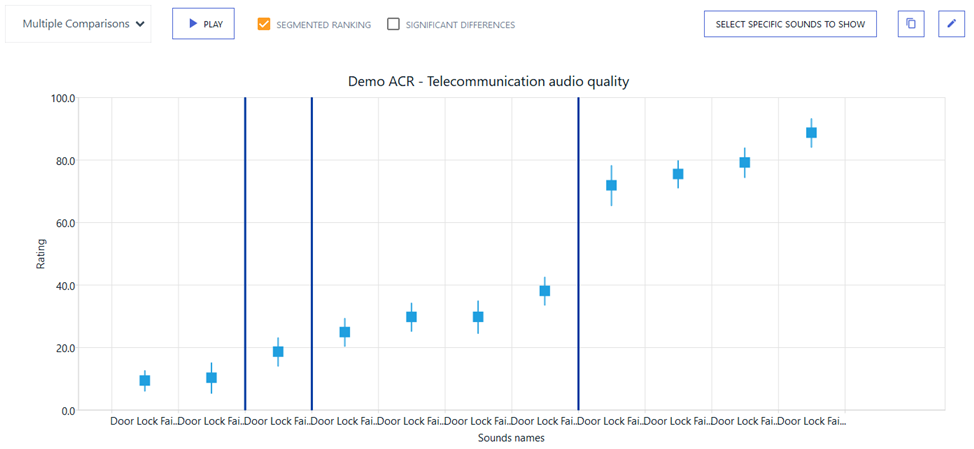
This procedure shows how to split the sound dataset into several groups, according to the ranking of average ratings, but also taking into account individual rating variability, and whether or not average rating differences are significant.
-
In the Navigation panel, select Analysis &
result.

-
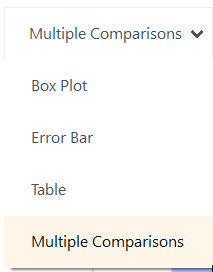
From the plot type drop-down list, select
Multiple Comparisons.
-
Enable SEGMENTED RANKING.

The blue lines are the limits of the groups (classes) of sounds.
Each sound between the same two blue lines belongs to a same group.