Splitting the View
This procedure shows how to split the view of the graphs.
To Split the View:
Note: Project Manager task.
-
In the Edition area, select a display layout from the list:
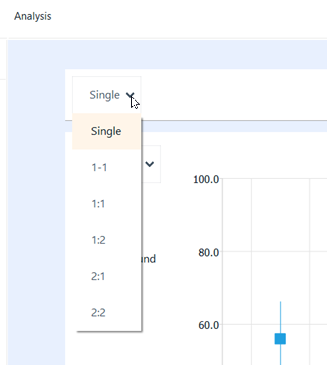
Single to display a single graph in the entire viewing area
1-1 to split the view into one graph at the top and one graph at the bottom.
1:1 to split the view into one graph on the left and one graph on the right.
1:2 to split the view into one graph on the left and two graphs on the right.
2:1 to split the view into two graphs on the left and one graph on the right.
2:2 to split the view into two graphs on the left and two graphs on the right.
The view is split.
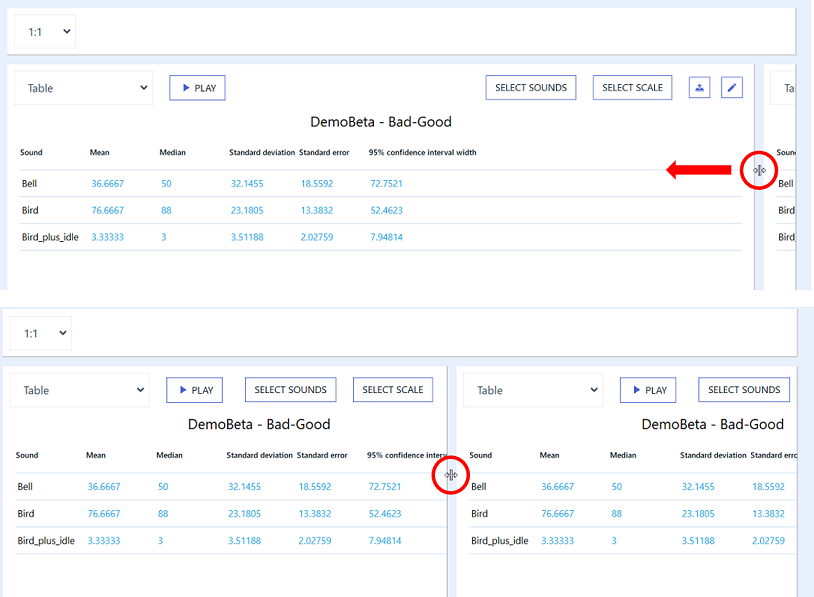
Tip:
Graphs can be displayed as desired by clicking and dragging the
cursor in the area located between them as showed below.