Visualizing Significant Differences
This procedure shows how to evaluate, according to ratings, the difference between the average ratings of two sound and/or how to define classes of sounds.
To Visualize Differences:
-
In the Navigation panel, select Analysis & results.

-
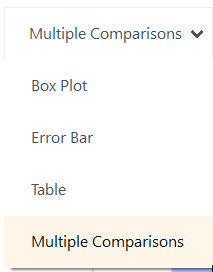
From the plot type drop-down list, select Multiple Comparisons.
-
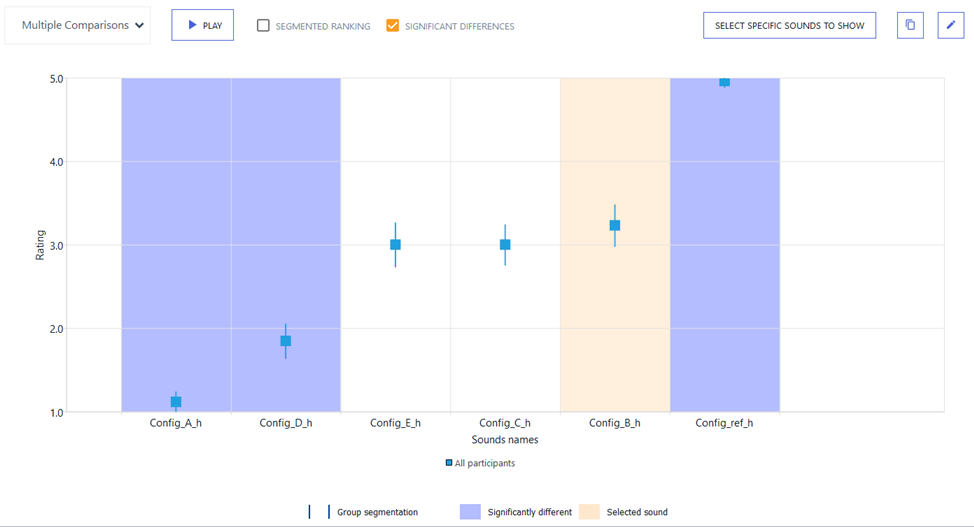
Enable SIGNIFICANT
DIFFERENCES.

A sound emphasized with a blue background color is identified as different from the reference sound.
A sound with a white background is not significantly different from the reference sound