Spider Chart
The Spider Chart (for Semantic Differential only) can be seen as the Identity Card of a sound, in the sense that it displays how the sound is perceived over several scales (each scale is an attribute of the sound).
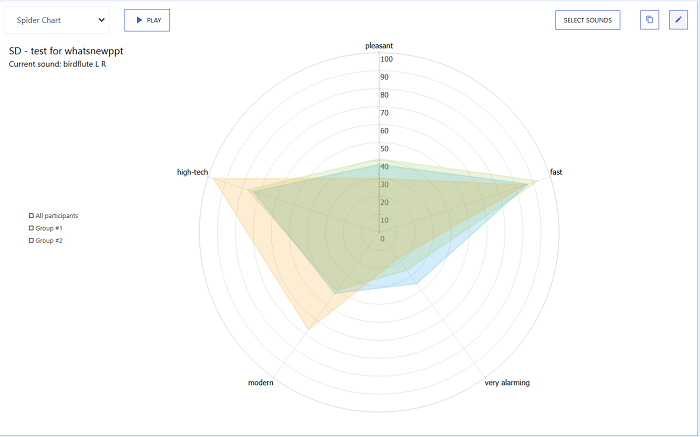
The graph - sometimes also called Radar Chart - is a representation of the mean value (average of the rating of all the participants in a same group), for all the scales of the listening test.
Each line starting from the center of the circle represents a scale. The scale is identified by its maximum value (number) and the term associated to it (the label corresponding to the max of the scale).
First scale label is used as the top label on the graph, and then the scales are ordered clockwise.