In Ansys Sound: Jury Listening Test, Segmented Ranking allows you to split the sound
dataset into several groups of sounds. These groups are created according to the ranking of
average ratings, but also take into account individual rating variability, and whether or not
average rating differences are significant.
Two sounds therefore have a higher chance to be classified in two different groups if
their average ratings are highly different and their individual rating variabilities are
low.
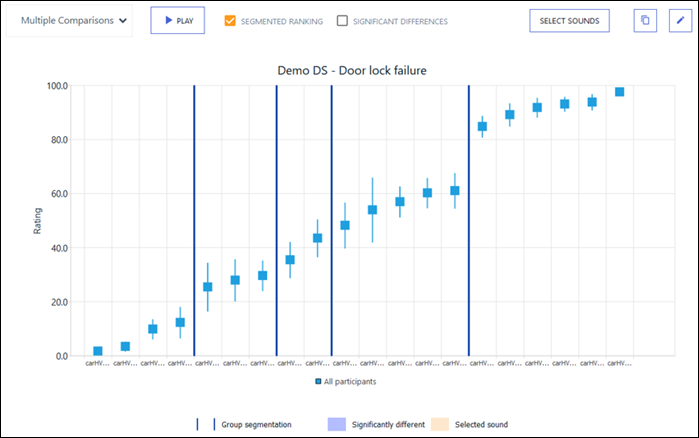
In the graph below, you can see several groups of sounds, separated by vertical blue
lines.
The segmented ranking in Ansys Sound: Jury Listening Test is based on a method that identifies
groups of sounds (classes). It is a proprietary method that was empirically designed to
detect scale points where strong differences exist between adjacent average ratings,
with respect to their associated inter-individual differences. It starts from the
p-values calculated from paired t-tests applied on every possible pair of sounds, but
does not rely on any other existing standards. Its main principles are explained
below:
Considering that sounds are sorted in ascending average rating order, two metrics
and are evaluated based on the p-values calculated from paired t-tests
between all possible pairs of sounds.
The metric is calculated as follows:
For each sound i, the p-values of tests with every sound with a lower
average rating are summed (all sounds with index < i).
The metric for sound i is then the ratio between its p-value sum,
and that of the previous sound (in ascending average rating order):
Where denotes the p-value of the test between sounds i and
k.
The second metric () is obtained with the same method, except this time only sounds
with higher average ratings are considered when summing p-values:
For each distribution of values of these two metrics, quartiles Q1 and Q3, and the inter-quartile range IQR are calculated.
Then, sound i is considered as an outlier if either of the following two
conditions is met:
The detection of each outlier marks a separation (also called a segmentation)
between two sound groups.
In summary, you look at how significantly different, from a statistical standpoint, each
sound is from sounds with lower average ratings on the one hand, and higher average ratings
on the other hand. You then create a sound group separation when these statistical
differences are much larger on average compared with the distribution of statistical
differences between all sounds.
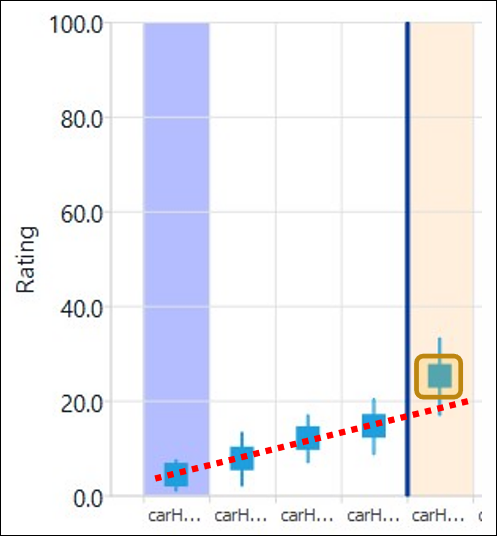
The figure below illustrates this. The selected sound (in pale orange) is displayed as not
significantly different from 3 of the 4 other sounds with lower average ratings. However,
if you look at this graph in its entirety, you cannot help but notice that the rightmost
sound has a mean rating that noticeably departs from the trend followed by the previous
four sounds (identified by the red dotted line). There is a 'break point' in the statistics
of ratings at that particular sound. This is what the segmented ranking method is able to
detect, and a segmentation mark (vertical blue line) is therefore created between this
sound and the four sounds below it.


 and
and  are evaluated based on the p-values calculated from paired t-tests
between all possible pairs of sounds.
are evaluated based on the p-values calculated from paired t-tests
between all possible pairs of sounds. for sound i is then the ratio between its p-value sum,
and that of the previous sound (in ascending average rating order):
for sound i is then the ratio between its p-value sum,
and that of the previous sound (in ascending average rating order): 
 denotes the p-value of the test between sounds i and
k.
denotes the p-value of the test between sounds i and
k. ) is obtained with the same method, except this time only sounds
with higher average ratings are considered when summing p-values:
) is obtained with the same method, except this time only sounds
with higher average ratings are considered when summing p-values: