View Analysis Result for Design of Experiments
After completing an analysis, right-click the Design of Experiments setup in the Project Manager pane and select View Analysis Result. This opens a dialog box that includes a Result tab that lists the variations and variable values, a solution Profile tab with start, stop, time elapsed, and machines used, as well as a Response Surface tab. When you include more than one variable in the setup, response surface view is available. Click  next to the view list box to choose any two variables as the X-, Y-axis, and choose an output calculation as the Z-axis.
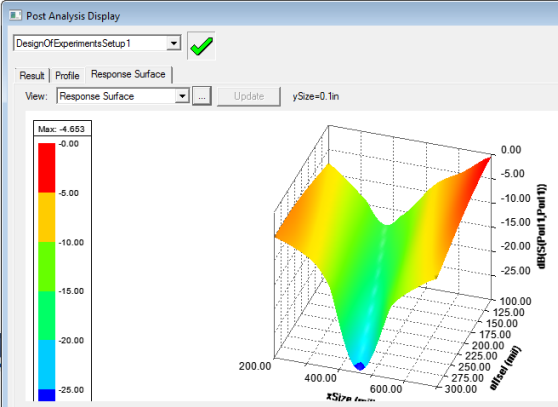
From the Response Surface tab, the View list box lets you select all available views of the selected response-surface-setup.
- Min Max Search
- Refinement points table
- Response points table
- Verification points table
- Goodness of Fit
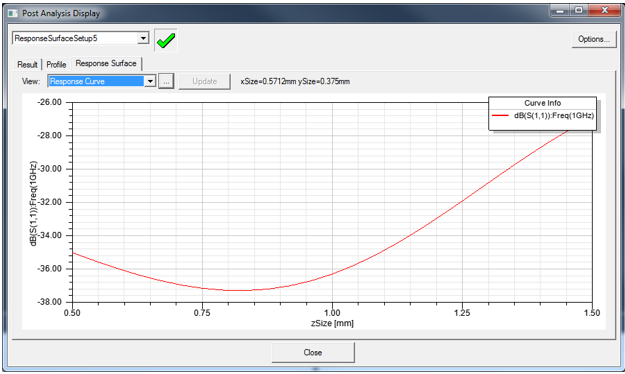
- Response Curve (see below)
- Response Curve (2D Slices, see below)
- Response Surface
The Update button is disabled when the response surface is up to date. After the setup, if you modify a verification point or refinement points, it is enabled. Click Update to re-generate the response surface with new settings. It may start new simulations if any of the design points in the DOE, refinement points, or verification points has not been solved.
Response Curve
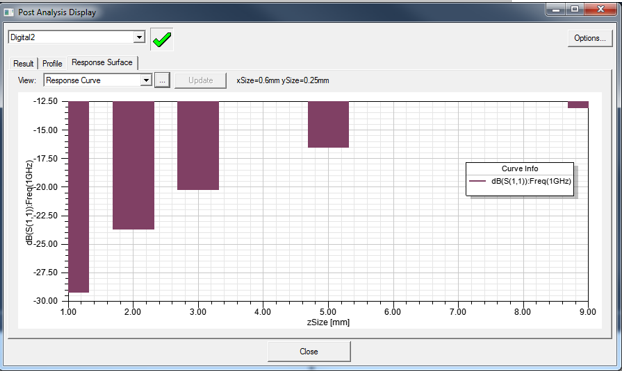
Discrete Variable
If you choose Discrete Variable as the X-axis, a bar chart plot appears:
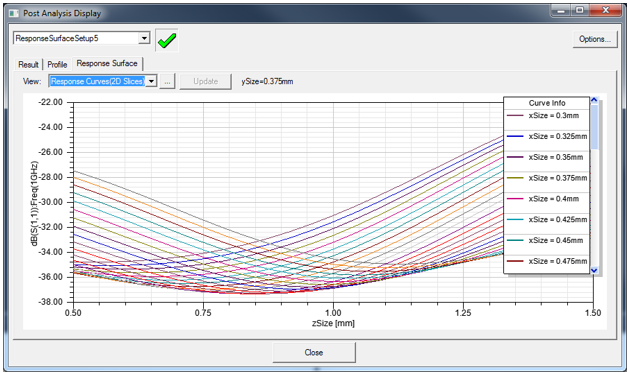
Response Curves (2D Slices)
If you have included more than one variable in the setup, the Response Curves (2D) view is available: