
Response Surface Results Design of Experiments Result
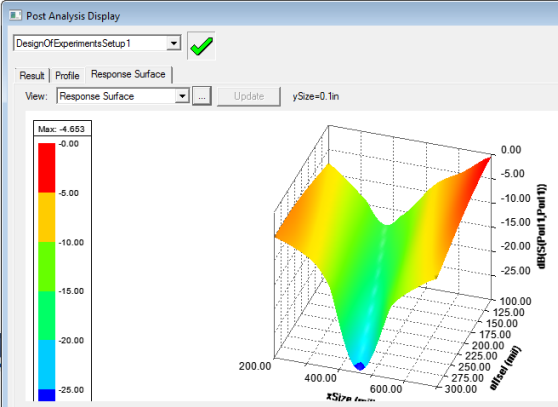
When more than one variable is included in the setup, the Response Surface view is available. You can choose any two variables as the X- or Y-axis, and choose an output calculation as the Z-axis; click  and browse for the variables. From the Response Surface tab of the Design of Experiments Post Analysis Display dialog box, the View list box lets you select all available views of the selected response-surface-setup.
Response surfaces are functions of varying natures in which the output parameters are described in terms of the input parameters. Built from the Design of Experiments (DOE), they quickly provide the approximate values of the output parameters throughout the design space without having to perform a complete solution. The accuracy of a response surface depends on several factors: the complexity of the variations of the solution, the number of points in the original DOE, and the response surface type. Once a response surface is generated, you can create and manage response points and charts. These postprocessing tools help you to understand how each output parameter is driven by input parameters and how you can modify your design to improve its performance.
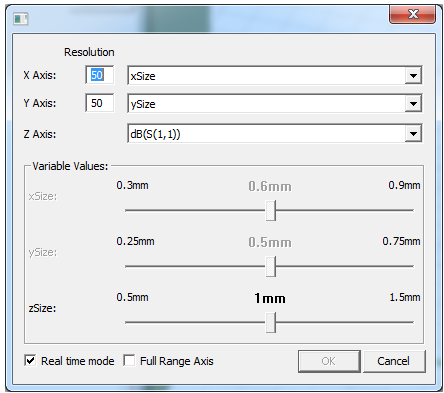
Click  to adjust the variables selected and the values applied. A separate dialog box, pictured below, appears.
Tuning a Response Surface
For the X-axis and Y-axis, you can specify a resolution, and the variable to use. For the Z-axis you can select the cost or calculation. For variables not selected for the X- and Y-axis, a slider is enabled that lets you adjust the value to see the effect on the response surface plot. You can enable or disable Real time mode with the check box at the lower left.
Full Range Axis check box
When you select this check box, all axes are set to their maximum ranges, and the ranges won’t be changed while tuning unless you change the axis variable.
When you clear this check box, the Y-axis (2D) and Z-axis (3D) axis range updates to fit the curve/surface.
Accumulate Response Curve
The check box is cleared when the tuning dialog box opens, and it won’t restore its last state. When selected, it will retain the existing curves, and add new curves to the plot. Clearing the check box won’t clear the accumulated curves, but new curves will no longer be accumulated. When the axis variable changes, all accumulated curves are cleared.
Exporting Response Surface Data
You can export the response surface data as a table in the following formats:
- Comma delimited data (CSV) files.
- Tab delimited data (TAB) files.
- Ansoft Plot data (DAT) files.
- Post Processor format data (TXT) files.
You can import the exported files into a report.