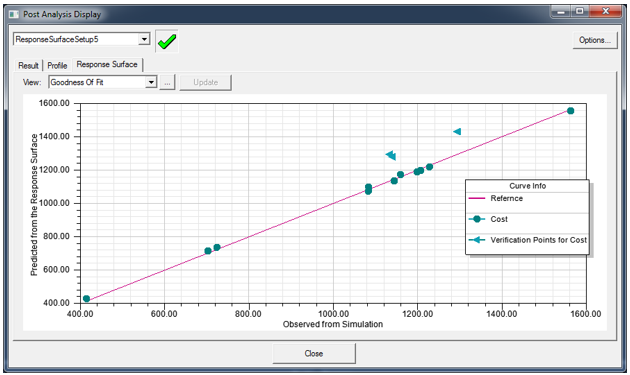
Goodness of Fit (Predicted vs Observed Chart)
From the Response Surface tab, the View list box lets you select all available views of the selected response-surface-setup. Response surfaces are built from design points in the Design of Experiments (DOE) and refinement points (collectively, called learning points). The Goodness of Fit calculations compare the response surface outputs with the DOE results used to create them.
The closer the points are to the diagonal line, the better the response surface fits the points.
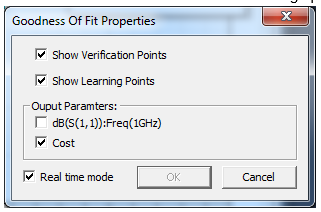
You can view Goodness of Fit information for any of the output parameters in a response surface. To do so click  to bring up the Goodness of Fit Properties dialog box.