
Drawing an Equation-Based Curve
Any line that can be described by an equation in three dimensions can be drawn. Before you draw am equation-based curve, you can specify the coordinate system, and you can set the drawing plane as Z, Y, or Z, or you can edit the plane in the properties.
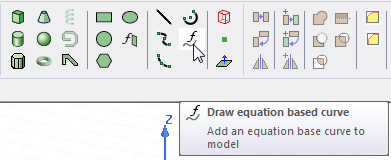
- From the menu bar, click Draw>
 Equation Based Curve or, on the Draw ribbon tab, click the Draw equation based curve icon:
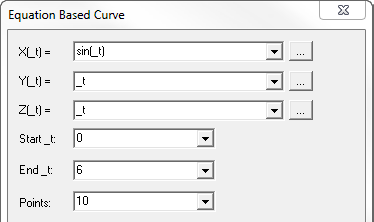
The Equation Based Curve dialog box opens:
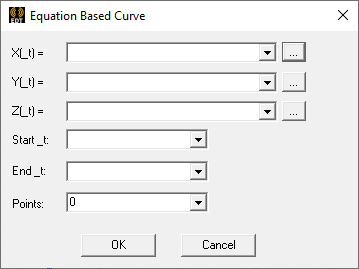
- Type equations for X(_t), Y(_t), and Z(_t)
You can also define an equation by doing the following:
- Click an ellipsis button [...].
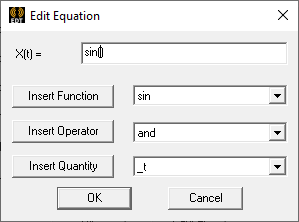
The Edit Equation dialog box appears:
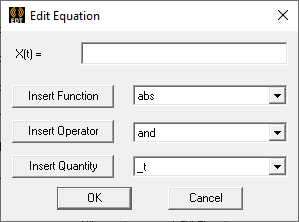
- Do one or more of the following to define the equation:
- Type a numerical value, variable, or expression directly in the text box.
- Build an equation for X(_t), Y(_t), or Z(_t) by specifying appropriate function, operator, and quantity to insert into the expression from the three drop-down menus:
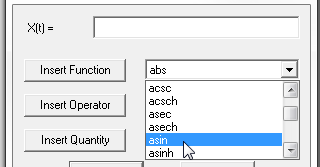
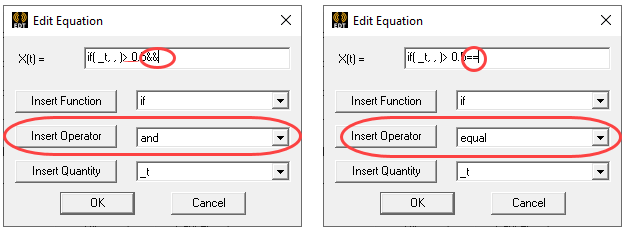
Click the corresponding Insert Function, Insert Operator, or Insert Quantity buttons to insert the selections into the equation text box at the current cursor location. The if( , ,) function has been added under Insert Function.
The Insert Operator button inserts corresponding operator:
- Use a combination of the preceding two methods to build complex equations.
- When you are finished defining the equation, click OK to close the Edit Equation dialog box and return to the Equation Based Curve dialog box.
Note:- The equations are taken to be meters. Use of units in equations is not properly supported.
- While parsing expressions, equation based curves convert each variable separately to model units and assume that the resulting expression is in model units.
- Equation based curves depend on the variable value library to correctly evaluate the units of expression.
- Functions that do not support intrinsic (_t for curve, _u and _v for surface) will give an error if not supported.
- Click an ellipsis button [...].
- Select a start value from the Start_t drop-down menu.
- Select an end value from the End_t drop-down menu.
- Type in or select the number of points in the curve from the Points drop-down menu.
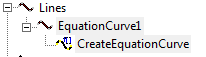
- Click OK on dialog to close it and create the curve.
The curve appears in the modeler window, and the History tree shows the curve object and the command.
If the Modeler option for editing properties of new primitives is checked, the Properties dialog box appears, in which you can modify the object's attributes by
The Properties listed as line attributes include Name, Orientation, whether a Model object, whether to Display Wireframe, Color, Transparency, and whether to Show Direction as arrows. The Show Direction property is most helpful to unambiguously show the line start orientation when