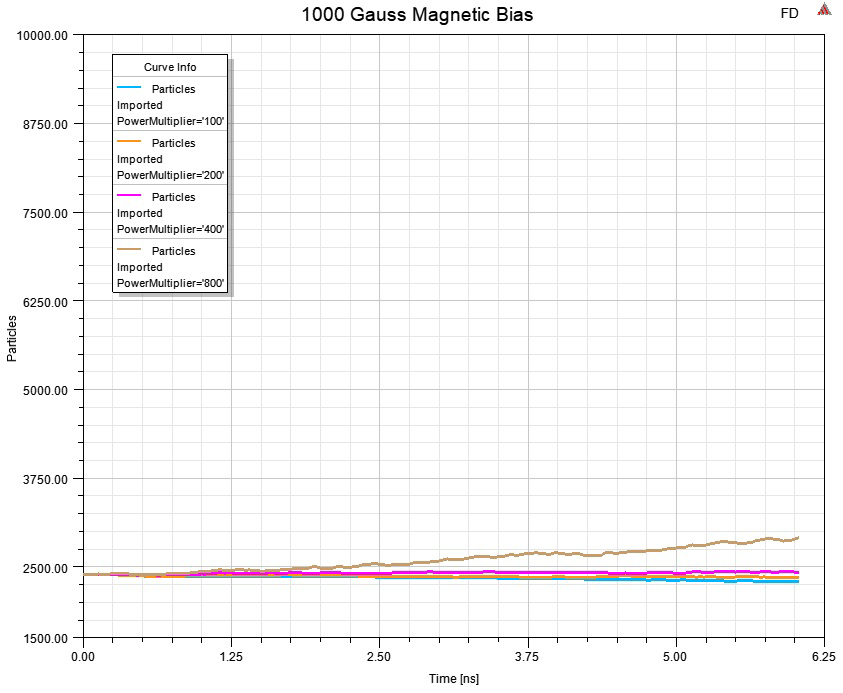
Plotting the Charge Evolution
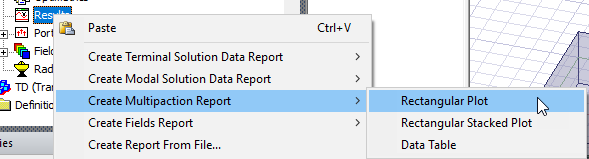
The final step is to plot the charge evolution through multipaction plots. You can right-click on results, select Create Multipaction Report, and select the report type.
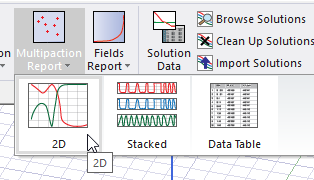
You can also access the Multipaction Reports on the Results tab of the ribbon.
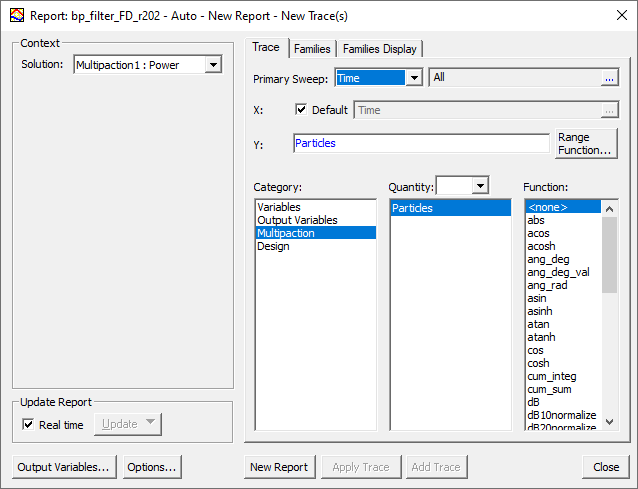
In the Report dialog box, select Multipaction as the Category and Particles as the Quantity.
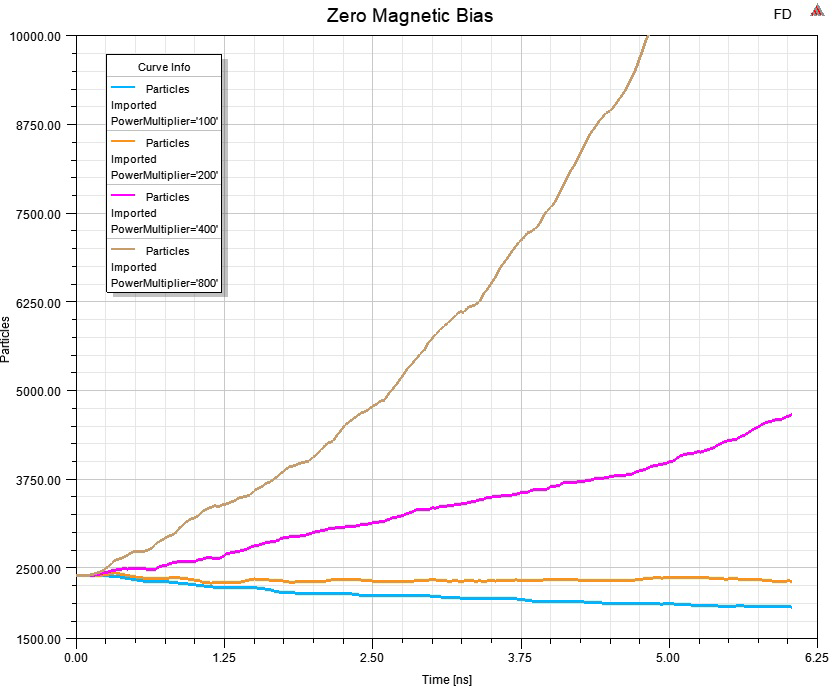
The following example report shows the results with different PowerMultipliers and Zero Magnetic Bias.
The following example shows a range of power multipliers with a 1000 Gauss Magnetic Bias assigned.