Displaying and Saving Average SEY on Material Surfaces
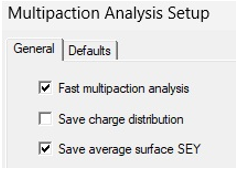
For displaying the average secondary emission yield (SEY) on material surfaces, you must select Save average surface SEY in the Multipaction Analysis Setup before running a multipaction simulation.
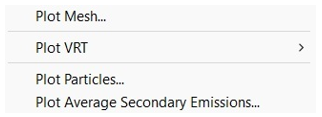
Once the simulation is completed, you can plot the average secondary emission yield on selected material surfaces.
The information is typically used to identify hot spots of multipaction or to check the effectiveness of multipaction suppression tactics.
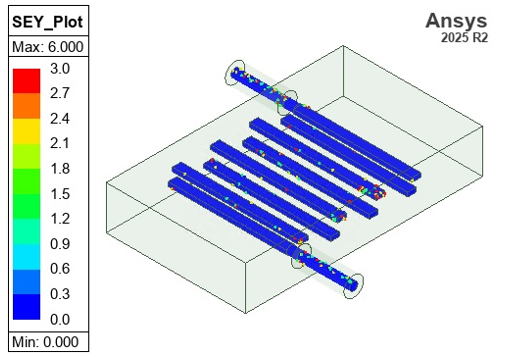
For example, the following plot shows the collision points and their corresponding average SEY for a bandpass filter with multipaction.
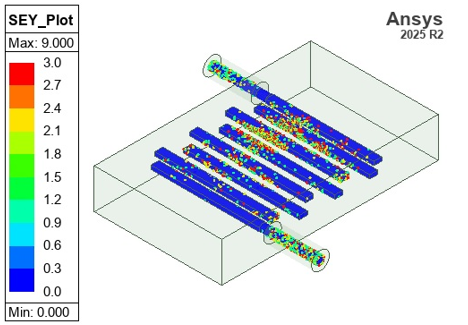
After applying magnetic biases to the coaxial feeds, the multipaction is effectively reduced so the SEY plot is mostly dark.