


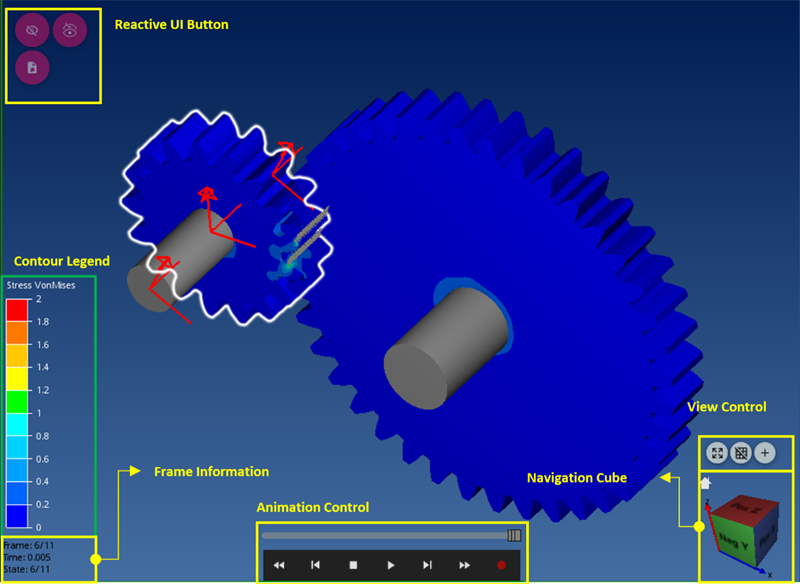
Animation view shows the geometries of the model that is referred to in the imported DFR file. This view consists of various regions such as Reactive UI Button, Contour Legend, Frame Information, Animation Control, Navigation Cube, and View Control as shown in the figure and table below.
Figure 3.1: Various functions in animation view
| Contents | Description |
| Reactive UI Button | Use to show the available functions for selected objects such as geometry, DFN file, and a node in the chart list. |
| Contour Legend | Use to show the range and type of contour. |
| Frame Information | Use to show the animation frame, time, and state. |
| Animation Control | Use to show animation controls such as animation , , and . |
| Navigation Cube | Use to show the animation cube. |
| View Control | Use to show the view controls such as and . |
Animation controls are usually hidden. When the mouse is hovering over the region of animation control, the animation controls are displayed as shown in the figure below. Animation functions such as , , and are available from the animation control below the table.
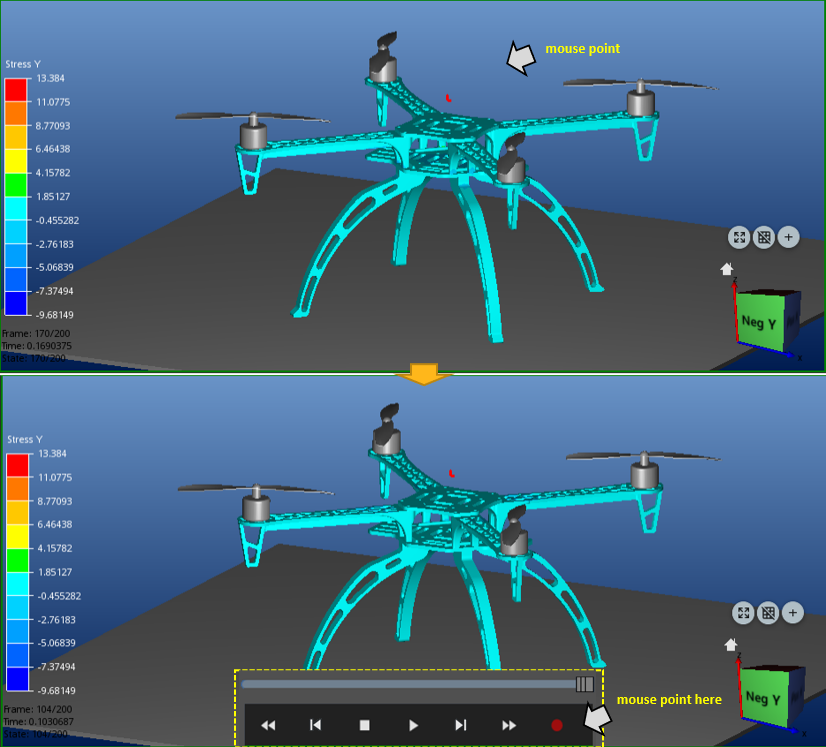
Figure 3.4: Various functions of the animation control
| Contents | Description | ||||||||
 | Use to move to the first frame. | ||||||||
 | Use to move to the previous frame. | ||||||||
 | Use to stop playing the animation. | ||||||||
 | Use to play the animation. | ||||||||
 | Use to move to the next frame. | ||||||||
 | Use to move to the last frame. | ||||||||
  | Use to record the animation. The status will be shown in red or gray depending on whether recording is available. See Recording. | ||||||||
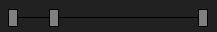 |
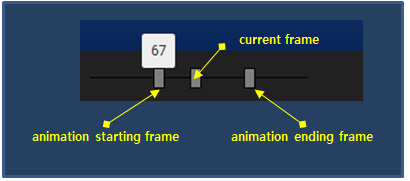
Use to set animation frames such as start, current, and end frames by clicking and dragging the frame bar.
|
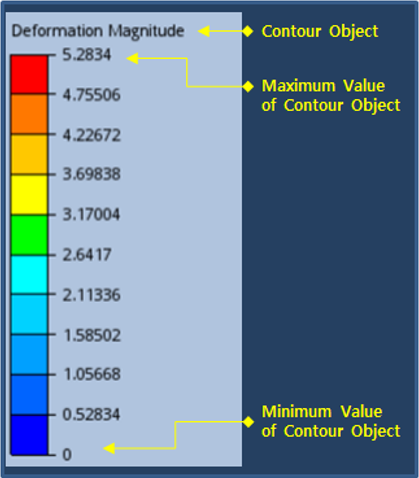
When a contour is defined in the animation view, the legend for the contour will be displayed. The legend divides the minimum and maximum values of the contour object into several sections, and shows the value and color corresponding to each section. Several parameters are supported to control the legend from Contour Properties.
Animation view provides frame information. If the animation is for a dynamic solution, Animation Frame, Time, and Result Frame are displayed in the view as shown in the figure and table below.
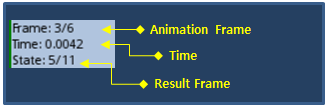
Figure 3.7: Frame Information for a Dynamic Solution
| Contents | Description |
| Animation Frame | Used to show the currently displayed frame for the entire loaded frameset. |
| Time | Used to show the time of currently displayed frame. |
| Result Frame | Used to show the currently displayed frame for the entire frameset written in the simulation result file. |
If the animation is for an eigenvalue solution, Animation Frame, Time, and Result Frame are displayed in the view as shown in the figure and table below.
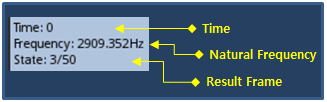
Figure 3.9: Frame Information for Eigenvalue Solution
| Contents | Description |
| Time | Used to show the time when the mode shapes and natural frequencies are calculated. |
| Natural Frequency | Used to show the natural frequency of currently displayed mode shape. |
| Result Frame | Used to show the currently displayed frame within the entire frameset. |
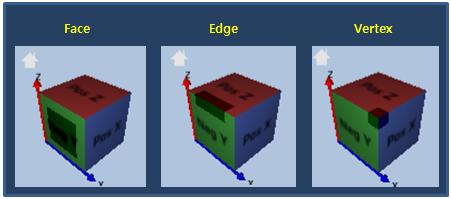
You can easily change the view point by using the navigation cube. The view point can be changed by clicking one of faces, edges, or vertexes of the navigation cube as shown in figure below.
The view point can also be changed by clicking the buttons near the navigation cube as shown in the figure and table below.
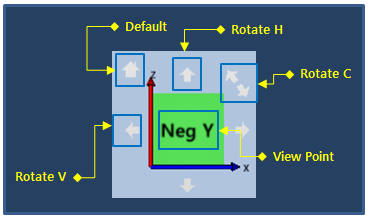
Figure 3.12: Rotation Buttons in Navigation Cube
| Contents | Description |
| Default | Use to change the view point to the default setting. |
| Rotate C | Use to rotate the view point in the counterclockwise or clockwise direction. For example, in the figure above, if the button is clicked, the XZ plane will be changed to the -ZX plane. |
| Rotate H | Use to rotate the view point by +/- 90 degrese around the horizontal axis. For example, in the figure above, if the upper button is clicked, the XZ plane will be changed to the XY plane. |
| Rotate V | Use to rotate the view point by +/- 90 degree around the vertical axis. For example, in the figure above, if the left button is clicked, the XZ plane will be changed to the -YZ plane. |
| View Point | Use to show the view point of face. Here, Neg and Pos means negative and positive, respectively. |
Animation view and chart view support the reactive UI buttons. The buttons are normally hidden, but are activated when the object is selected as shown in the figure below.
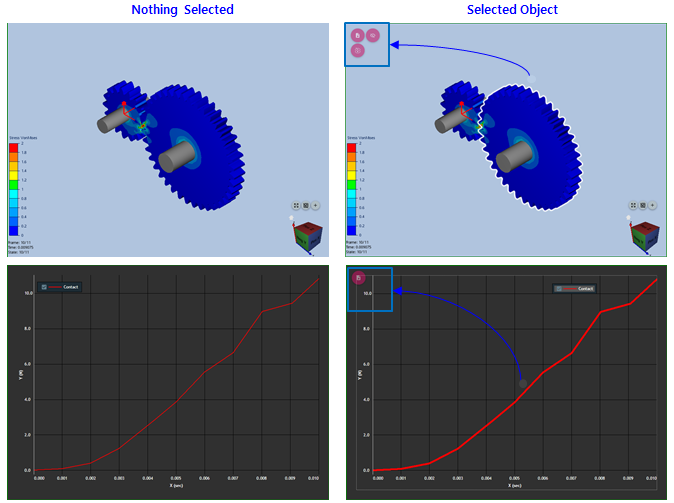
The reactive UI buttons shown varies depending on the type of selected object as shown in the table below.
Figure 3.14: Reactive UI Buttons in Animation View
| Button | Tool Tip | Object | Description |
 | Hide | Displayed Objects | Use to hide selected objects. |
 | Hide Others | Displayed Objects | Use to hide all except the selected objects. |
 | Show | Hidden Objects | Use to show the selected hidden objects. |
 | Show All | Hidden or Displayed Objects | Use to show all objects when the view has a hidden object. |
 | Export Nodal Body Position | Nodal FE Body | Use to export a DFN file. |
 | Export Modal Raw Data | Modal FE Body | Use to export a DFMODAL file. |
 | Add to Tree | Node or Element of FE Body or EF (EasyFlex) Body | Use to add the selected node or element to the list of nodes and elements. |
 | Delete | Objects created by Postprocessor | Use to delete the selected object. |
 | Enable Camera | Camera Objects | Use to enable the selected camera. |
 | Disable Camera | Camera Objects | Use to disable the selected camera. |
Figure 3.15: Reactive UI Buttons in Chart View
| Button | Tool Tip | Object | Description |
 | Export | Curve | Use to export the numeric data. |
 | Export | ODT Curve | Use to export the order tracking curve. |
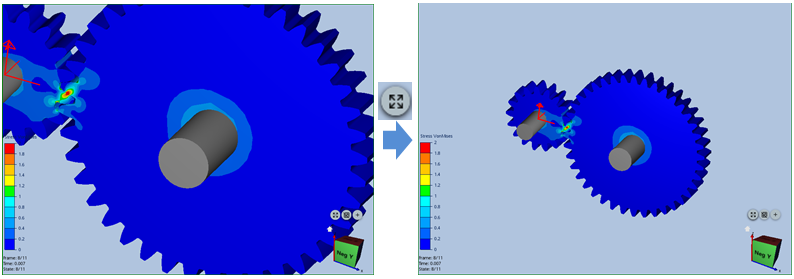
View control provides functions for the and as shown in the table below.
Figure 3.16: View Control
| Button | Description |
 | Use to fit the screen to see all objects in the view. |
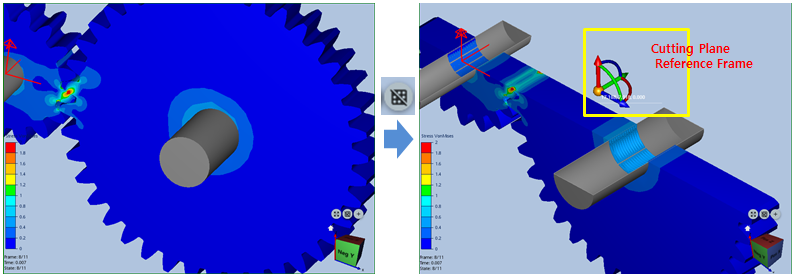
 | Use to activate or deactivate the cutting plane. |
 | Use to show the rendering mode. |
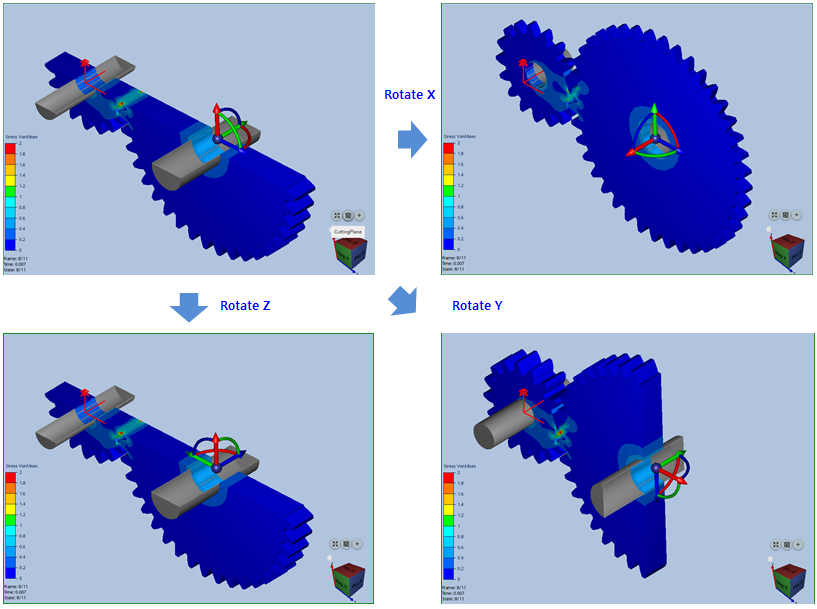
Cutting plane is used to create a sectional view showing internal details that cannot be seen from the outside. You can observe the internal organization of your model or contour by using cutting plane. The default cutting plane is the XY plane of the inertia reference frame and you can control the cutting plane while translating or rotating the cutting plane reference frame as shown in figures below.
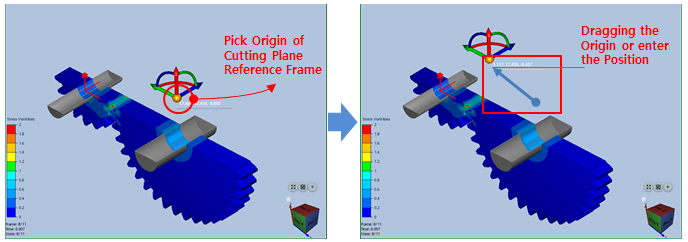
The cutting plane reference frame can be moved by dragging the origin of the reference frame or entering the position vector in the input field as shown in the figures below.
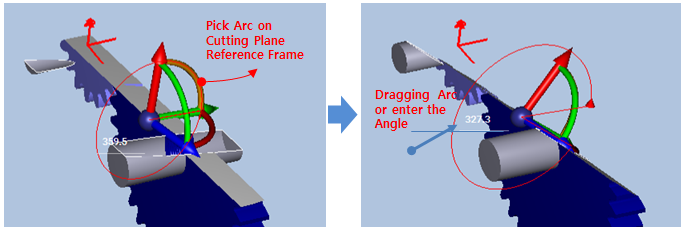
The cutting plane reference frame can be rotated by dragging the arc of the reference frame or entering the angle in the input field as shown in the figures below.
Rendering mode provides several techniques to visualize the 3D geometry on a 2D screen as shown in the figure and table below.
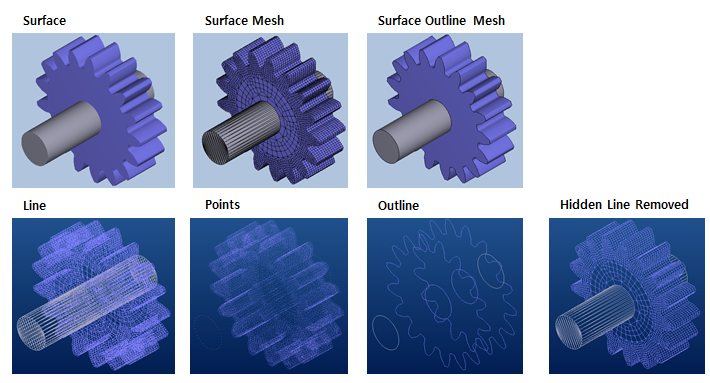
Figure 3.23: Rendering Modes
| Button | Rendering | Description |
 | Surface | Use to see the surface with shading effect. |
 | Surface Mesh | Use to see the surface with mesh lines. |
 | Surface Outline Mesh | Use to see the surface with outlines. |
 | Line | Use to see the mesh lines. |
 | Points | Use to see the mesh points. |
 | Outline | Use to see the outlines. |
 | Hidden Line Removed | Use to see the mesh lines removed hidden lines. |