When the crack selected in the Crack Selection property of your Fracture Tool is associated with a SMART Crack Growth object, a Probe group of options is available in the Fracture Tool Context tab and includes the fracture parameter probes listed below. Fracture probes enable you to view the time history of a fracture parameter (that is, SIFS, Crack Extension, etc.) for a specific crack front node along the crack front (tip) only.
//
*
*
* Available when the Crack Growth Option property, of SMART Crack Growth object, is set to .
Also see the Fracture Probes object reference page.
Go to a section topic:
Extract Fracture Probe Results from a Result File
When you have saved a results file (file.rst) from another fracture analysis, you can read this file into a different analysis and extract the result data with a Fracture Tool. Note the following requirements:
For a Pre-Meshed Crack, you can evaluate the fracture probes without defining the crack in the new analysis, but with similar boundary conditions.
For all other crack types, your analysis must include a defined Fracture folder, a matching mesh (including crack mesh), as well as defined boundary conditions.
Use the following steps to specify a Fracture Tool and to extract fracture results and probes from the result file.
Read the results file into your analysis. As needed, review the Writing and Reading the Mechanical APDL Application Files section.
Select the Solution object, open the drop-down menu from the Solution Context tab, and select the Fracture Tool option. Based on the settings of the Fracture Controls of the Analysis Settings object, a result object, such as SIFS (K1), is automatically included under the Fracture Tool.
Set the Scoping Method property to .
From the Fracture Tool Context tab, select and insert desired probe results.
From the drop-down list of the Solver ID property, select the appropriate solver ID value for each result. You can now evaluate the specific results.
Display Features
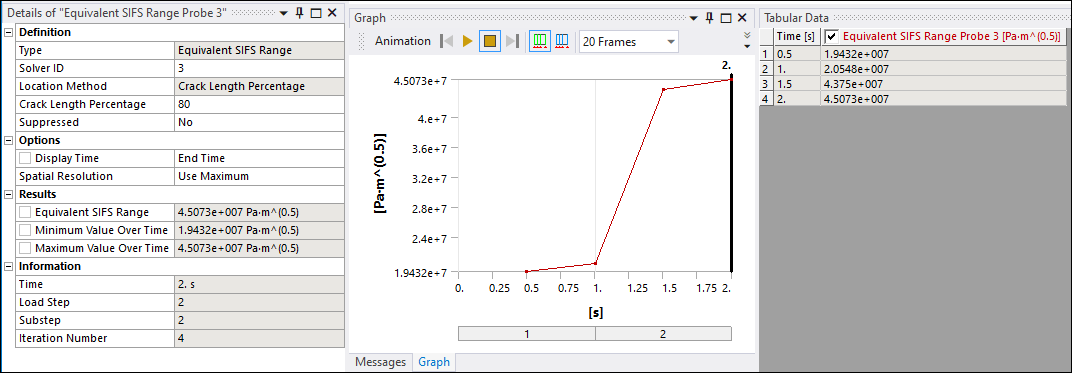
Once evaluated, probe results are plotted against time in the Graph window as illustrated below for a SIFS probe.
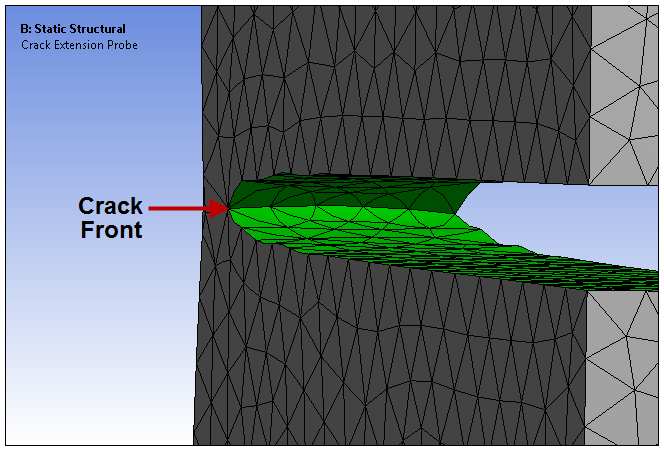
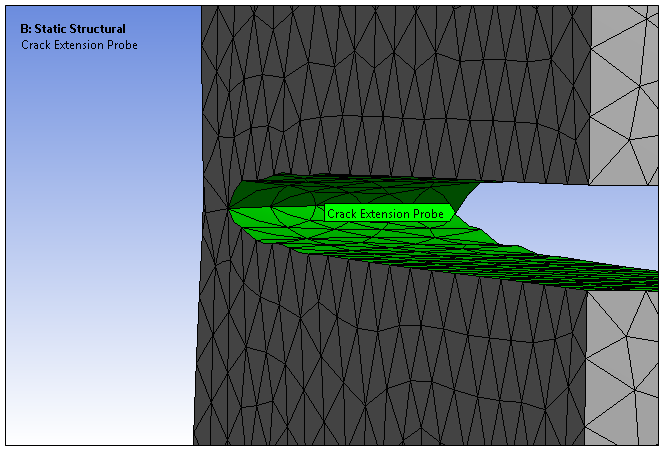
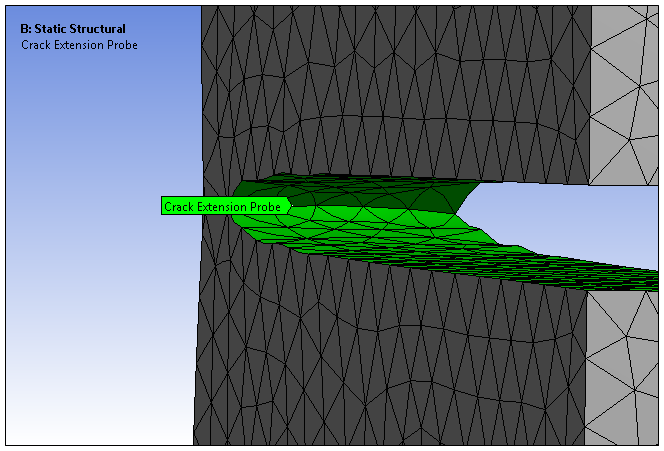
Another graphical display feature is that, when you have a fracture probe object selected, crack surfaces display in green in the Geometry window, as illustrated below. Furthermore, you can also see the tip of the crack.
Using the Crack Length Percentage property, you can move the probe along the crack front. Because the results vary along the crack front, you can use this percentage entry to select a point along the tip you wish to examine. By changing the Crack Length Percentage you should receive different time history plots. An example is illustrated below.
| Crack Length Percentage 0% | Crack Length Percentage 70% |
|---|---|
|
|
|
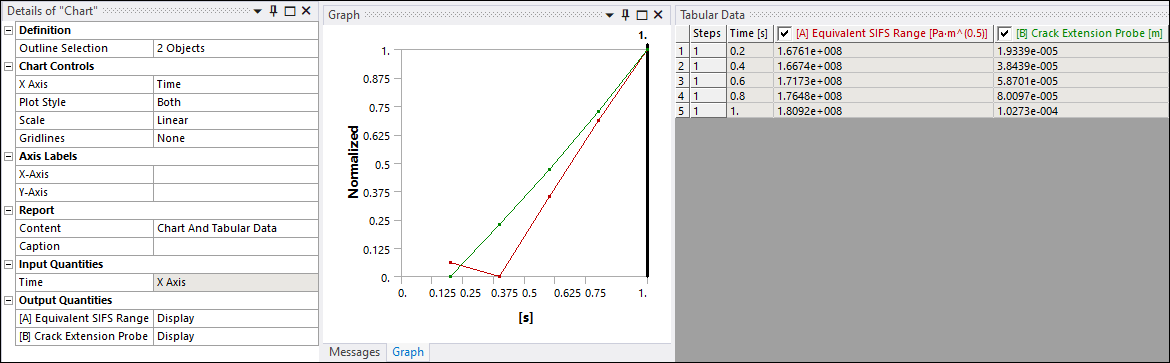
Charting Fracture Probes
Using the data generated by fracture probes, you can employ the New Chart and Table option to plot your probes results against time or against one another. For example, the result of a SIFS probe is plotted versus the result of a Crack Extension probe is illustrated below.