


The System Coupling GUI includes the following components:
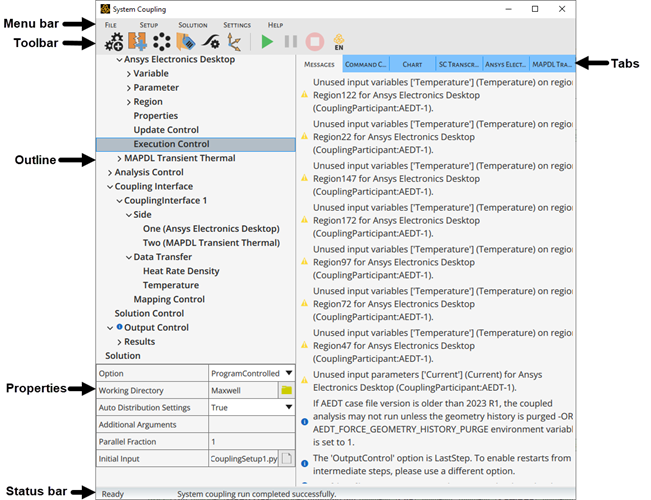
The Menu Bar contains the , , , , and menus.
For details on available options, see Menu-Bar Menus.
The Toolbar includes buttons for the following operations. These buttons are equivalent to the corresponding menu bar and context menu options.
Buttons are displayed and enabled according to the type and state of the analysis.
| Button | Function |
|---|---|
 | Add Participant |
 | Add Interface |
 | Add Instancing |
 | Add Named Expression |
 | Add Expression Function |
 | Add Reference Frame |
 | Solve |
 | Preview Mapping |
 | Map |
 | Interrupt |
 | Abort |
 | Open Results in EnSight |
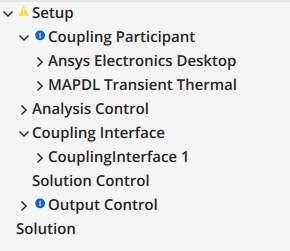
The Outline pane provides a tree view for object-focused management of the System Coupling workflow. This pane mirrors both the structure of the data model and the general sequence of steps in a coupled simulation. It is divided into two main branches, Setup and Solution. Each of these has child branches corresponding to the hierarchical organization of the data model's containers and objects.
Information shown in the tree corresponds to entries shown on the Messages tab. When a message applies to a branch of the tree, an icon is shown to the left of the affected branch. The icon indicates the type of information being reported and shows additional details when left-clicked. For more information, see System Coupling GUI Messages and Icons.
- Setup
The Setup branch is used to define data model content, including the addition of new objects as part of the setup process.
Setup issues that cause data model invalidation are noted on the Messages tab.
- Solution
The Solution branch is used to control the execution of the coupled analysis — to start the solution, to interrupt or abort it once started, and to open EnSight results once completed.
Parent branches can be expanded to show child branches, which may correspond to singleton containers, object containers, or objects. Parent branches with child containers can be expanded/collapsed to show their child containers. Settings under a parent branch are not represented in the tree but are shown in the Properties pane when the parent branch is selected.
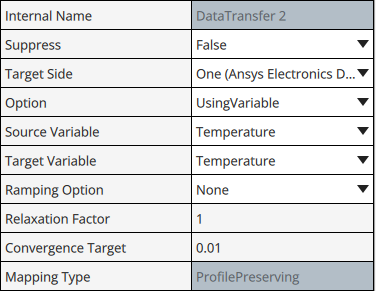
The Properties pane shows the settings associated with the object/branch selected above in the Outline, with the setting's name on the left and its value on the right. You can edit setting values by selecting or multi-selecting options from a menu and by typing new values into a text field.
For settings with text fields, invalid entries are indicated by red highlighting of the field and/or by messages on the Messages tab.
For settings requiring menu selection:
You can access a drop-down menu using the green down-arrow icon (
 ) to the right of
the field.
) to the right of
the field.For the Region List setting, if the list of available regions is long enough to require scrolling, you can access a Select Region control using the green ellipsis icon (
 ) to the
right of the field.
) to the
right of the field.
When a tab is selected, its contents are shown in the area below the tab. The System Coupling GUI has the following tabs: Messages, Command Console, Chart, SC Transcript, and Participant Transcript.
- Messages
Displayed by default. The Messages tab shows a list of state and/or informational messages for the coupled analysis. Information provided on the Messages tab is also reflected in the affected branch(es) of the Outline tree.
Each message includes an icon that indicates both the type of information being reported and its level of importance. By left-clicking the icon, you can navigate to the corresponding branch of the tree. For more information, see System Coupling GUI Messages and Icons.
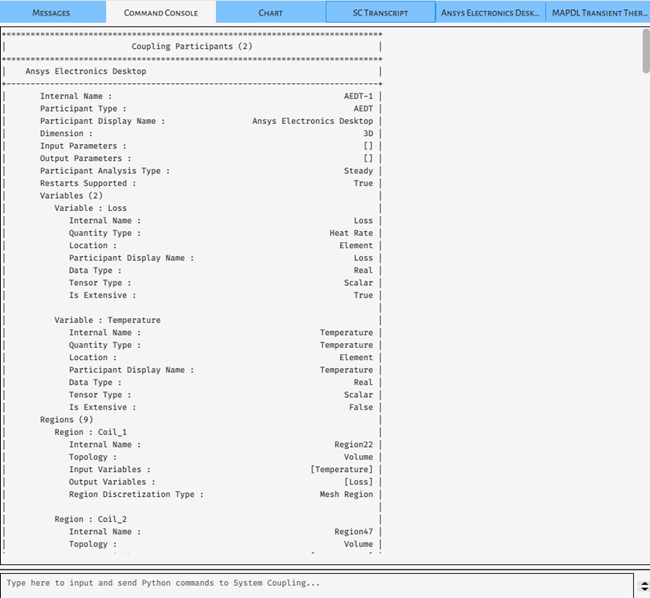
- Command Console
The Command Console tab is a Python console that enables you to interact with the data model via command line. The console is divided into two sections:
The body of the tab shows standard System Coupling output resulting from actions taken in the GUI. Output written here is not retained — if a solved case is saved and then restarted, then the output for the original solve will not be available.
The bottom of the tab has a Command Input area featuring a command line for entering and running Python commands.
Tip:System Coupling uses Python 3.10. To use the GUI's Command Console tab effectively, you should have some familiarity with working from your operating system command prompt and a basic knowledge of the Python language. For more information, see the resources published by the Python Software Foundation.
All sub-processes that are manually started from the Command Console tab will make use of the system environment that is setup for that console. Review and edit the environment passed to such sub-process if you encounter any problems with their execution.
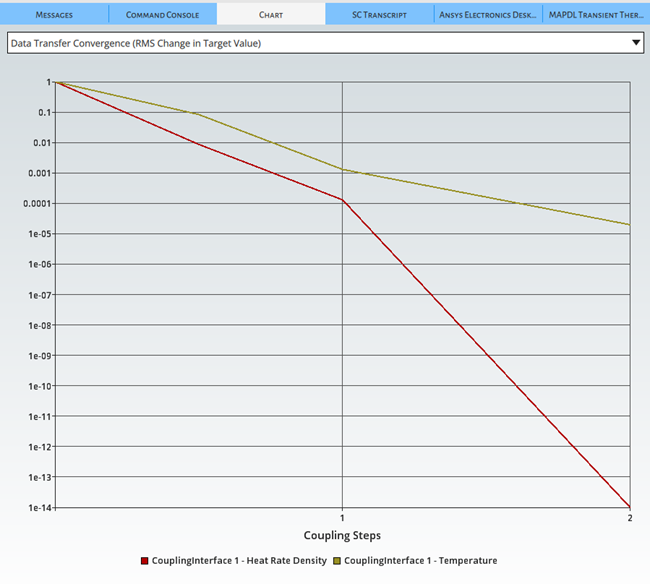
- Chart
The Chart tab shows convergence data for the analysis. It is shown by default when a solution is started and relevant data becomes available, so can be used to monitor convergence both during a run and after a coupling run.
Data is plotted on an auto-scaled XY line graph. The tab includes a chart selection menu, a legend of the chart data, and a menu for performing different chart operations.
For more information, see Reviewing Convergence Diagnostics Charting Output.
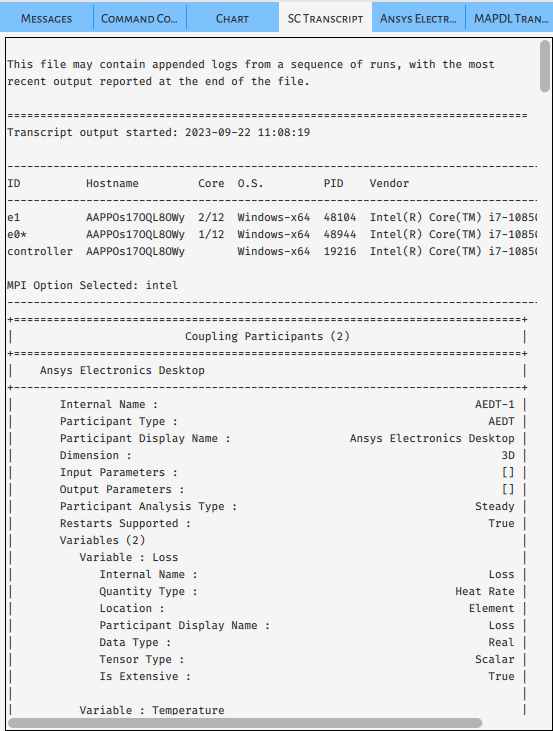
- SC Transcript
The SC Transcript tab shows System Coupling's transcript output for the coupled analysis. Output written to this tab is retained — if a solved case is saved and then restarted, then the output for the original solve will still be available.
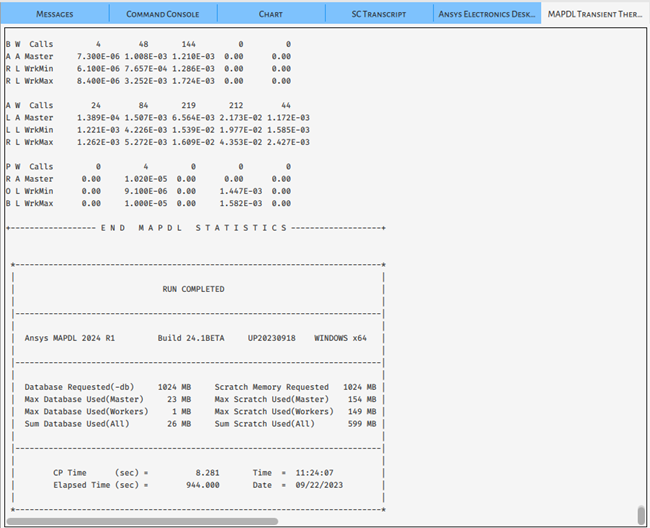
- Participant Transcript
The Participant Transcript tabs show the transcript output for each coupling participant in the coupled analysis, with one tab per participant.
Indicates the status of the coupled analysis.
On the left side, a status message indicates the status of the System Coupling engine. Possible messages are shown in the table below:
Table 12: Status messages
Message Description Ready
System Coupling is waiting for input.
Busy
System Coupling is busy (but not actively solving).
Solving
System Coupling is solving.
In the center, additional messages provide further details about the reported status. For instance, it indicates when System Coupling is waiting for participants to connect, when participants have been connected, the percentage of the analysis that's been completed, when the analysis has been stopped and for what reason, and so on.
On the right side, a progress bar shows the progress of the running solution.