


The chart buttons (Figure 2.7: The Chart Buttons) perform actions in the chart window and provides help for plotting curves.
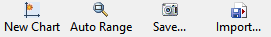
The following chart buttons are available:
The New Chart button (
 ) adds a new chart tab in the chart
window.
) adds a new chart tab in the chart
window.The Auto Range button (
 ) adjusts the scale of the axes of the
current chart tab to show all of the data points.
) adjusts the scale of the axes of the
current chart tab to show all of the data points.The Save... button (
 ) allows you to save an image of the
current chart to a file using the Save As dialog
box.
) allows you to save an image of the
current chart to a file using the Save As dialog
box.The Import... button (
 ) allows you to import a curve file
using the Import curve file dialog box.
) allows you to import a curve file
using the Import curve file dialog box.