


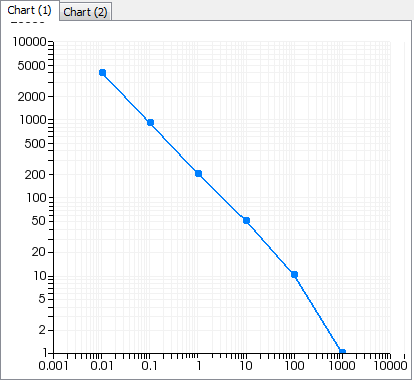
The chart window (Figure 2.8: The Chart Window) shows the experimental or computed curves. The chart window can display multiple chart tabs, and is updated by the Draw menu button or by the various curve buttons. See Defining and Plotting Curves for details.
You can translate the view of the curves by clicking the left mouse button in a chart and dragging the mouse. You can revise the magnification of the view, by hovering your mouse over the chart and rotating the scroll wheel of your mouse. You can also zoom in by positioning the mouse at the corner of the area to be magnified, holding down the middle mouse button, and dragging the mouse to create a rectangle; when you release the middle mouse button, the area within the rectangle will fill the chart.