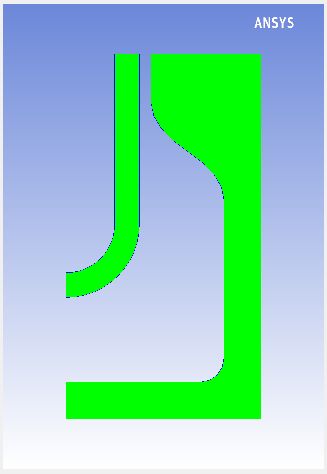
The Graphics Display window (Figure 2.12: Graphics Display Window) shows the mesh that you have read into Ansys Polydata.
Depending on the menu item being used, the Graphics Display window will be updated to show relevant information. For example, when you are setting flow boundary conditions, the mesh outline will be shown and the selected boundary set will change color.
You can manipulate the colors and view in the Graphics Display window using your mouse or the controls in the Graphics Display Options menu. See Examining the Mesh in Ansys Polydata for details.