The following sections show examples of the tabs available for each node type:
Project root node:
System nodes:
Leaf nodes:
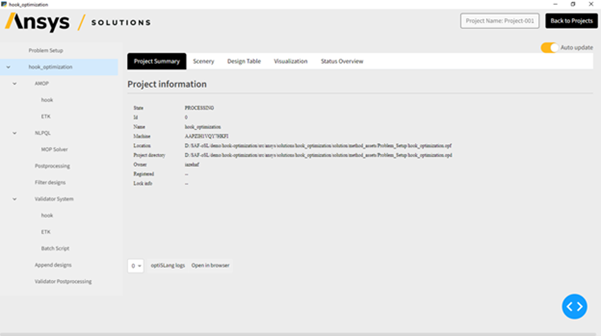
Project Summary tab
The Project Summary tab can be accessed on the root node page. It displays the following project attributes:
| Attribute | Description |
|---|---|
| State | Status of the project run |
| ID | Project ID |
| Name | Project name |
| Machine | Host name of the machine the project was started on |
| Location | Path to the optiSLang project file |
| Project directory | Link to browse the project working directory, if applicable |
| Owner | Project owner |
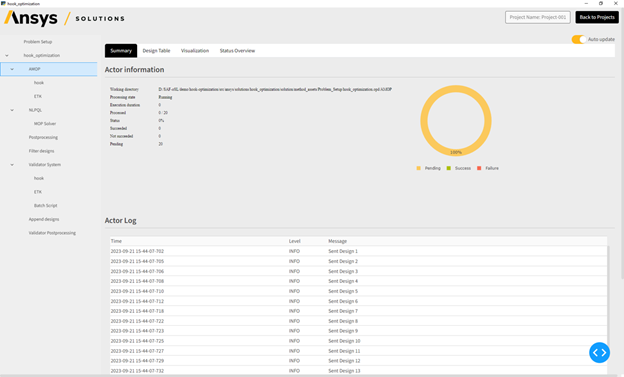
Summary tab
This tab contains information about the system status, name, location, etc., and gives an overall view of the the system's actual state. The log shows detailed information of all run designs of that system.
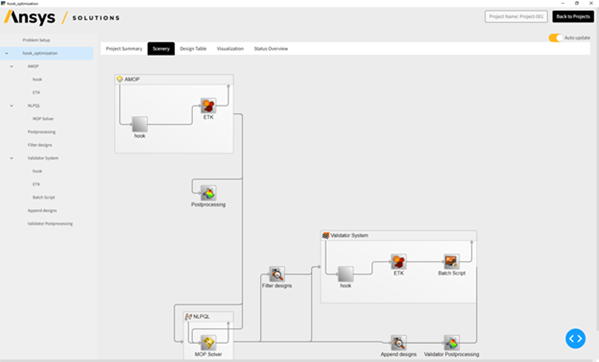
Scenery tab
The Scenery tab displays the same project view as the Scenery pane in optiSLang.
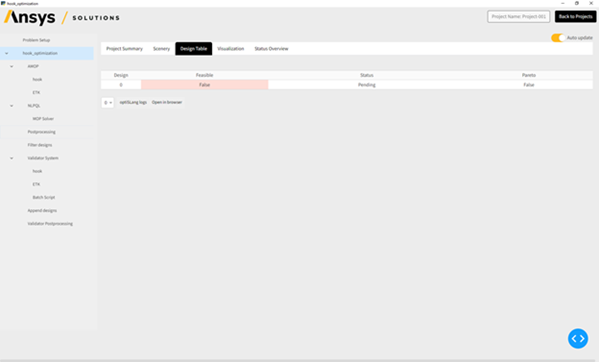
Design Table tab
The design table provides a tabular overview of the projects root node and the status of the designs as they are processed.
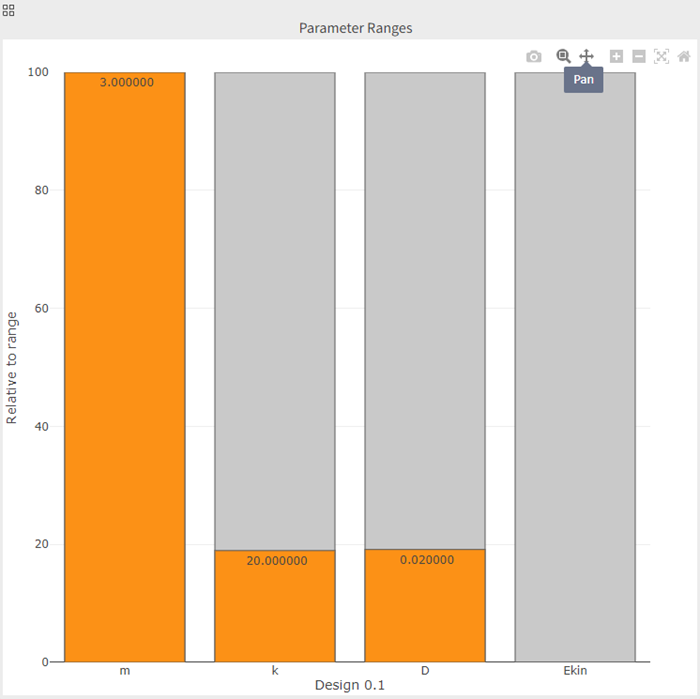
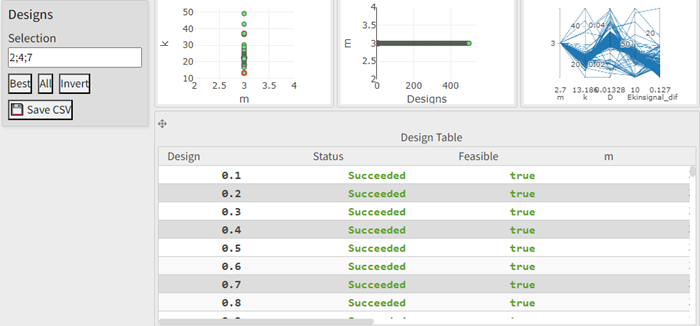
Visualization tab
This tab allows you to access postprocessing plots. This tab is available on
any root or system node page. This tab may show no
data at all, even if the run is finished, because no root design data was
generated.
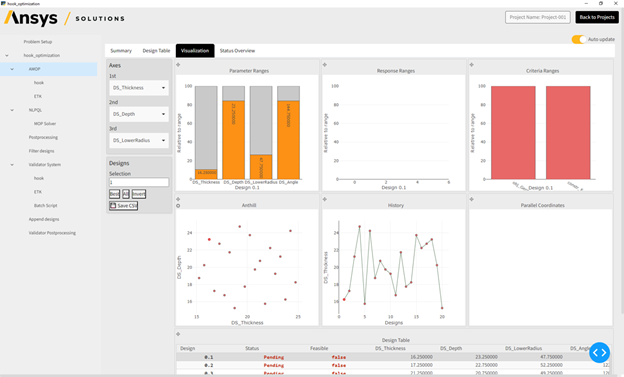
To use the postprocessing tools available on the Visualization tab:
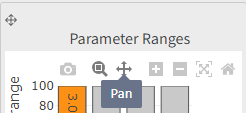
To manipulate a plot from the overview, hover over the plot and select a tool.
To expand a plot, click
 .
. 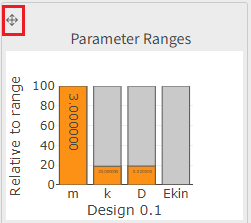
The plot is expanded to the fill the pane. You can hover over the right side of the plot to access manipulation tools.
To minimize the plot, click
 .
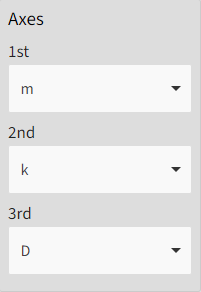
.To change the dimensions on the plot axes, select the 1st, 2nd, and 3rd dimensions from the Axes lists.
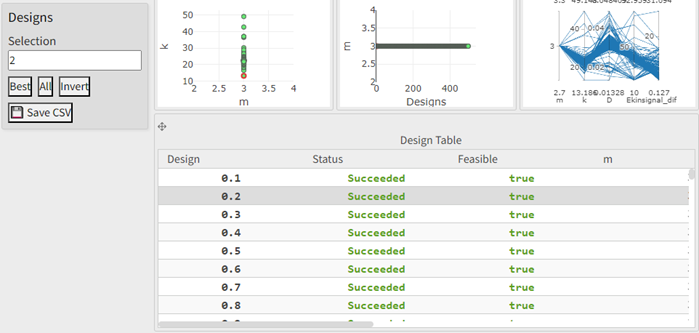
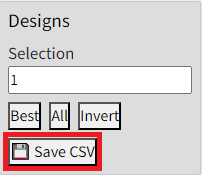
To select which designs are displayed in the plots:
Click a row in the Design Table or enter the row number in the Selection field.
To select multiple adjacent rows, click a row in the design table, press Shift, then select another table row. You can also enter the row numbers in the Selection field separated by a hyphen (-).
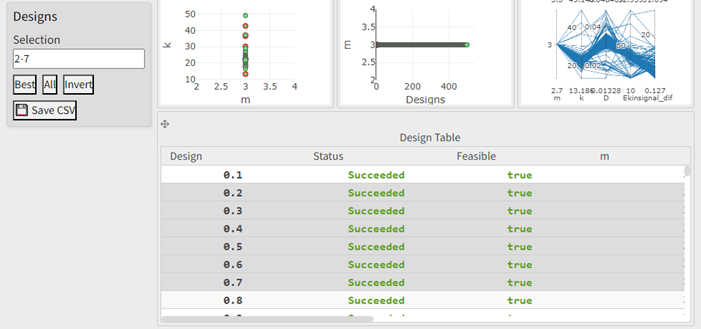
To select multiple non-adjacent rows, click a row in the design table, press Ctrl, then select one or more table rows. You can also enter the row numbers in the Selection field separated by a comma (,).
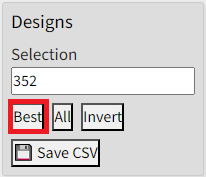
To select the best design, click Best.
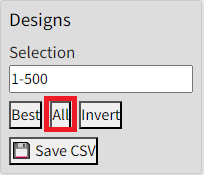
To select all designs in the table, click All.
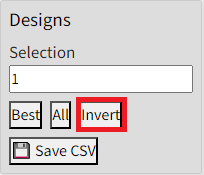
To change the selection to all currently deselected designs, click Invert.
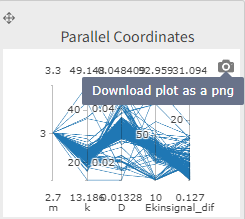
To save a plot as a png image, click the camera icon on the plot you want to save an image of.
To save the design table as a comma-separated values (CSV) file, click Save CSV.
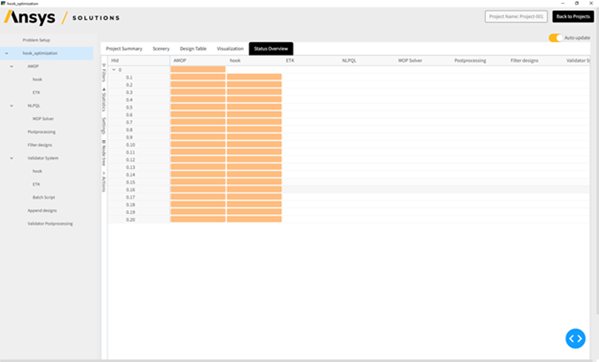
Status Overview tab
The Status Overview page allows you to view the status of project nodes. It consists of the status table, filters, and statistics. See the general Status Overview Pane page for more information.
This tab displays a tabular overview of the state of each node in the project. The columns display the project nodes while the rows display the design IDs run by the nodes. Each cell is colored according to the corresponding status:
White: No status information
Orange: Currently running
Green: Success
Red: Failure
Gray: Skipped