


Create and test run an Ansys Web Application
Create an optiSLang project just like you would for classic OWA apps.
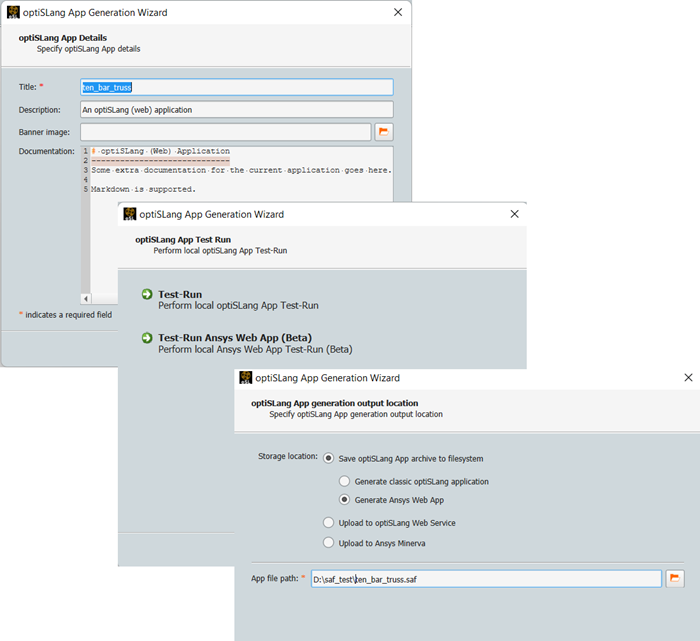
Go to File > Save current project as... > Generate optiSLang App... to execute the "optiSLang App Generation Wizard".
Go to the Test Run page to run a test of an Ansys Web Application locally.
Visit the Output location page to create the Ansys Web App archive and save it in the desired filesystem location.
Select the option Generate SAF application.
Complete the wizard to finish.
Ansys Web Application Execution
Launch the Ansys Web application via double clicking the App archive file. Once launched, you can use the capabilities of project preparation and project monitoring within the Ansys Web application.
Capabilities within the the Ansys Web application include:
Project preparation:
Configure the exposed project settings (project placeholders)
Upload awaited reference files
Project monitoring:
Project tree navigation
Summary for each project node and design combination
Project schematic view
Result designs overview display
Interactive result designs visualization
Full project status overview
Project log messages
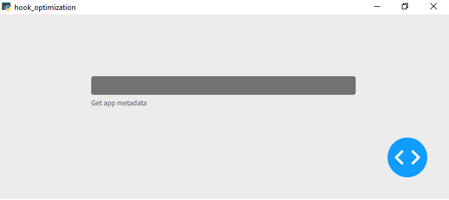
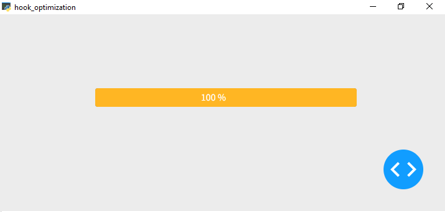
After executing the Ansys Web App, the application user interface opens. A progress bar indicates the status of the project initialization.
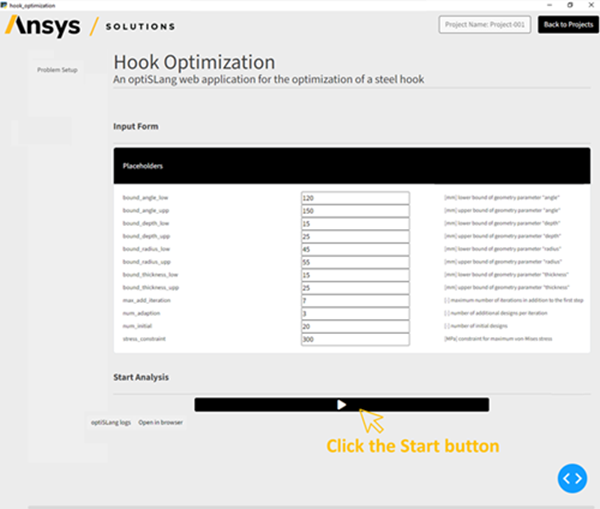
When the initialization completes, the solution opens to its Problem Setup page.
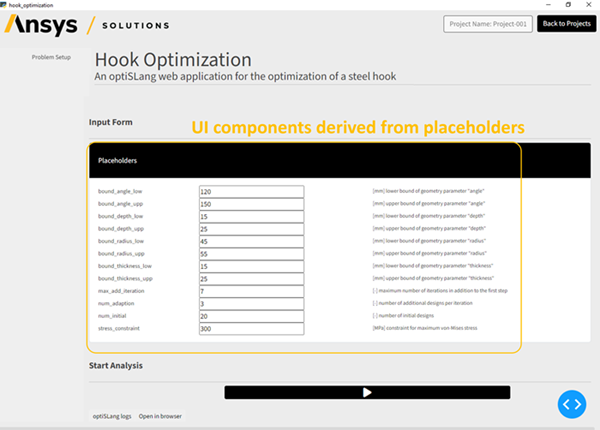
This page is built based on the placeholders defined in the project properties files (.json).
To start an analysis, click the Start button at the bottom of the Problem Setup page.
A spinner
 in the center
of the page indicates that the project run is initializing.
in the center
of the page indicates that the project run is initializing.Once the initialization completes:
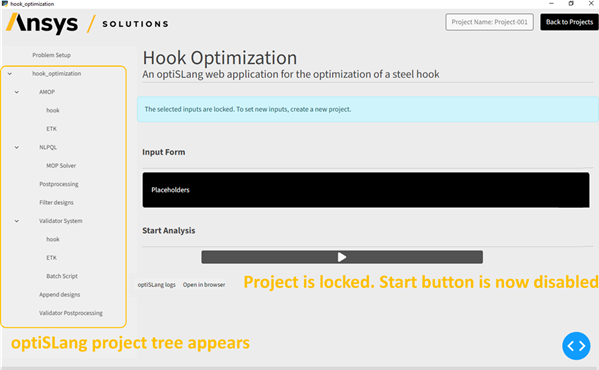
The tree view on the left side of the page is updated with the optiSLang project nodes.
The project setup is locked and the Start button is disabled.
The analysis execution begins.
Monitor the Analysis
To monitor the progress of the analysis:
Click on the node of interest.
The root node is the one just below Problem Setup.
Under the root node, all the child nodes are listed.
The set of tabs shown in the user interface depend on the type of node selected. Click on the tab with the information you want to see:
Project root node:
System nodes:
Leaf nodes:
Known Issues and Limitations
Project Setup:
Placeholder type "List of strings" not supported
Project Monitoring:
Actor Log shows multiline messages in single line
Download of result files not supported
Fine-granular execution control not supported
(Design Point) Visualization
Fully resets on each update. Consider switching Auto-Update to "Off".
Status Overview:
Does not react to node/system selection in the workflow component tree
Context menu actions for fine-granular execution control do not work
Fully resets on each update. Consider switching Auto-Update to "Off".
App documentation not accessible in App monitoring UI
General:
No Linux support