The Status overview pane allows you to view the status of project nodes and restart or reset the nodes. It consists of the node tree, status table, filters, statistics, settings, and working directory actions.
Node Tree
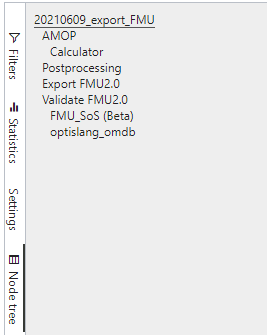
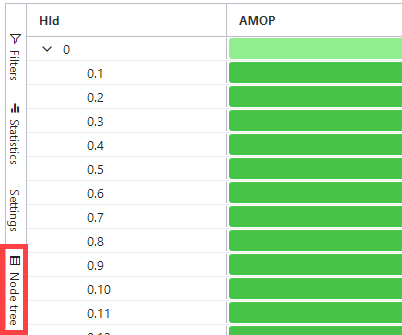
Allows you to navigate the project and restrict the columns which are shown in the node status table. Only nodes under and including the selected system are shown.
To hide and display the node tree, click the Node tree toggle.
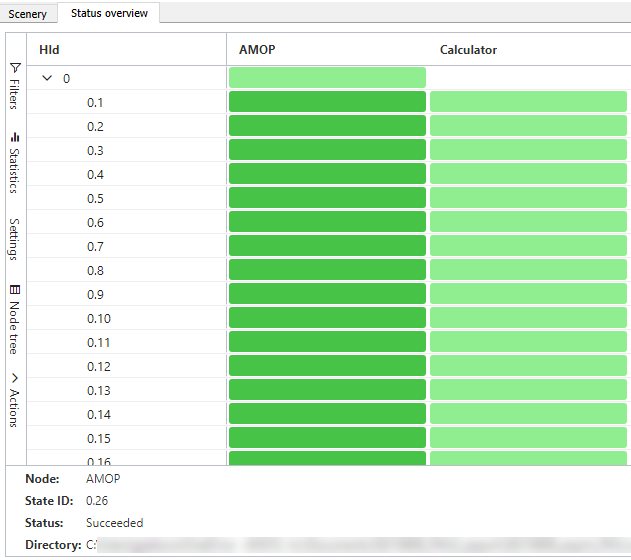
Status Table
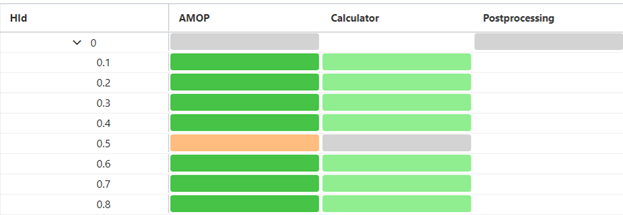
Displays a tabular overview of the state of each node in the project. The columns display the project nodes while the rows display the design IDs run by the nodes. Each cell is colorized according to the corresponding status:
White: No status information
Orange: Currently running
Green: Success
Red: Failure
Gray: Skipped
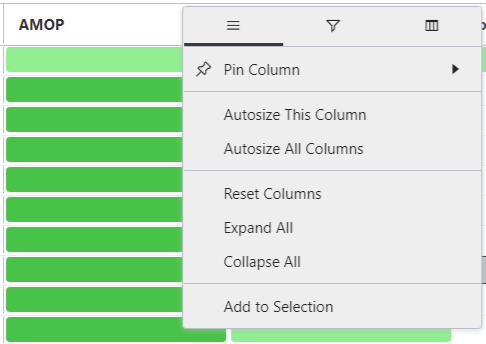
Column Organization
To pin, resize, expand, or collapse columns:
Hover over a column heading and click
 .
.Select an action from the displayed menu.
To hide and display columns:
Hover over a column heading and click
.Click
 .
.Select or clear the column check boxes to display or hide the columns.
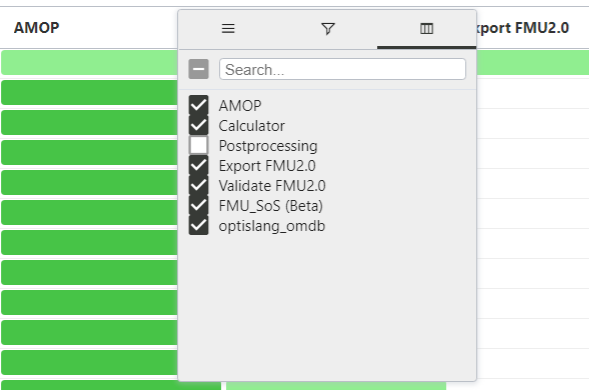
Tip: To filter the column list, use the Search field and enter a column name.
Cell Actions
Select one or more cells in the status table and right-click to open the context menu containing the following actions:
: Start cells that are not currently running
: Stop cells that are currently running
: Reset the status of cells that are not currently running
: Set failed cells as succeeded
: Opens the working directory folder for the design(s)
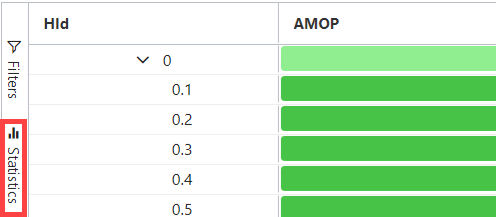
Filters
To apply filters to multiple status table columns:
Click the Filters toggle.
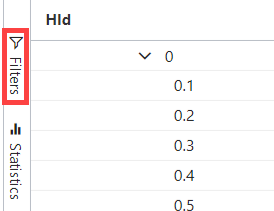
The list of columns is displayed.
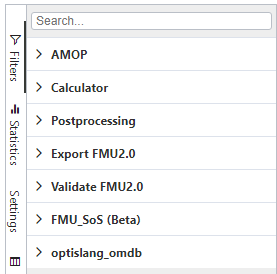
Expand the columns you want to filter.
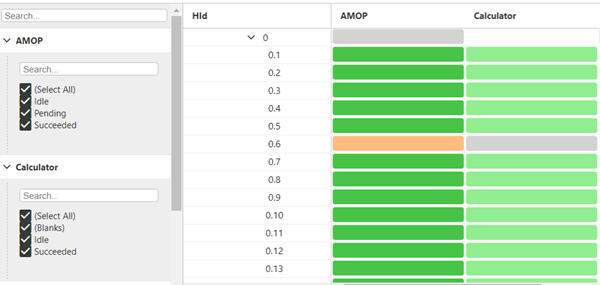
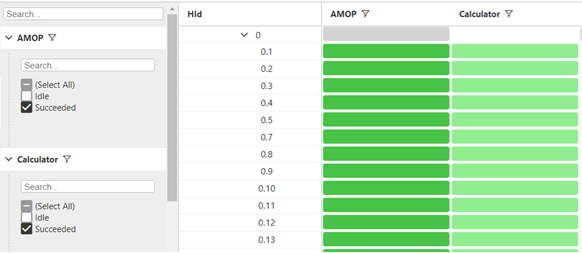
Select or clear the check boxes to hide or display status table rows.
Tip: To narrow down the available filters, use the Search field and enter a filter name.
To apply filters to a single status table column:
Hover over a column heading and click
.Click
 .
.Select or clear the check boxes to hide or display status table rows.
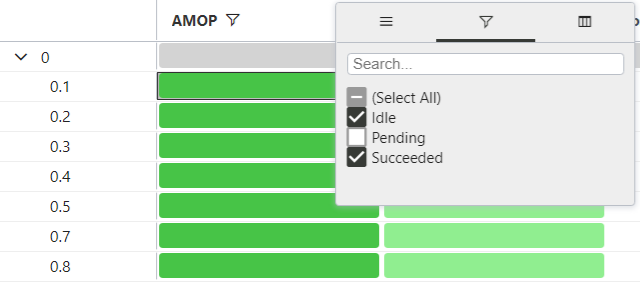
Tip: To narrow down the available filters, use the Search field and enter a filter name.
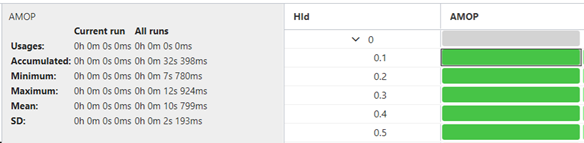
Statistics
Provides additional information including execution durations and usage statistics for the selected cell in the status table.
To view statistics:
Click a status table cell
Click the Statistics toggle.
The statistics for the cell are displayed.
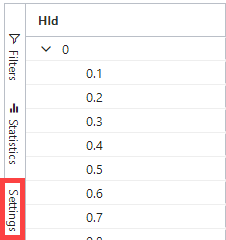
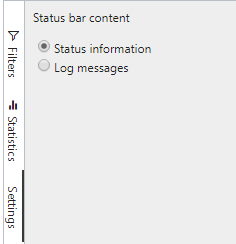
Settings
Allows you to display either status information or log messages.
To change settings:
Click the Settings toggle.
Select the content you want to display in the status bar.
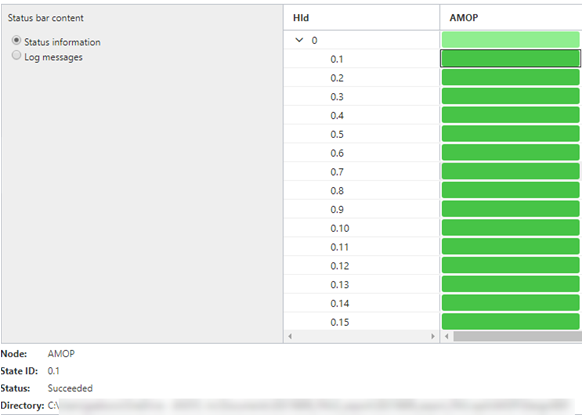
To display status information for the table cells, select .
When you select a cell from the status table with this setting enabled, the following information is displayed.
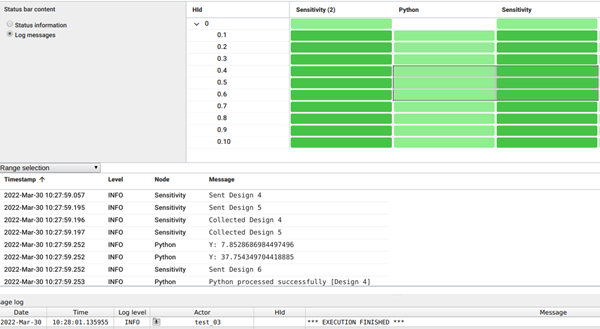
To display the log message table, select .

You can display log messages for:
The selected node/state combination only
All states in the nodes that are spanned by the selection
All nodes and states
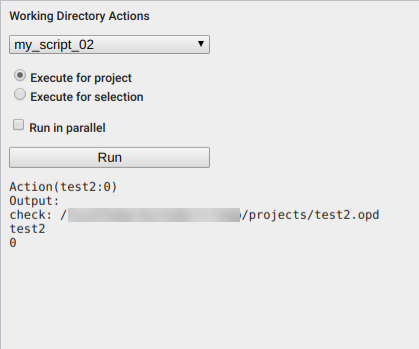
Working Directory Actions
Allows you to execute custom working directory action Python scripts.
The script must implement a function named run, which receives the
node/actor and state as arguments.
def run(actor, hid):
     pass
The following is a sample script that prints the arguments.
import os

def run(actor, hid):
    print("Working directory: " + str(os.getcwd()))
    print(actor)
    print(hid)
To use custom scripts:
Create an actions folder in <install_dir>/scripting.
Add your script files to the folder.
Click the Actions toggle.
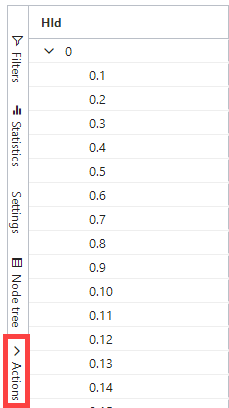
Select the script file from the drop-down menu.
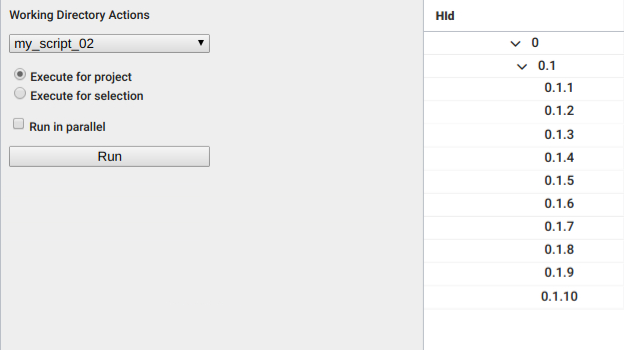
If you are executing the script for a selection of the project, select the appropriate table cells.
Select the execution method:
Executes the script once for the project, using the project directory as the script's working directory.
Executes the script once for each state in the current selection, the working directory depends on the combination of node and state (for example, Sensitivity/Design0023)
If you selected , you can optionally run the action for each selected cell distributed over multiple CPU cores. To do this, select the check box.
Click .
The script output is displayed.