


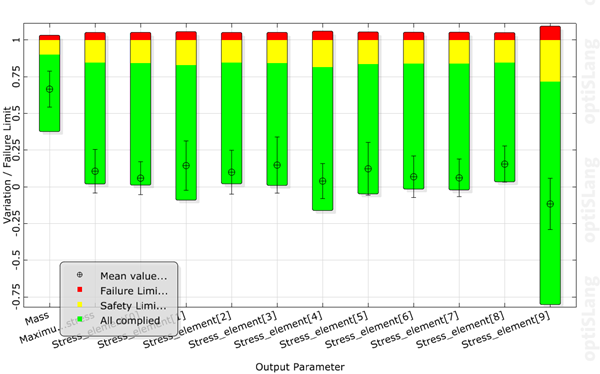
This plot shows the normalized values range of each response in relation to the mean value, standard deviation, a safety and a failure limit.
Settings
| Option | Description |
|---|---|
| Common Settings | |
| Show values sigma based | Toggles between the sigma based view and the original values. |
| Show statistic values | Toggles the view of a simplified box whisker with mean and +/- sigma value times sigma factor. |
| Sigma factor | Determines the length of the whiskers for the statistic values. |
| Preferences | |
|
The following preference settings are available:
For more details, see Plot Preference Settings. | |
Python Scripting
Create Visual
Creates a traffic light plot visual using data with data_id.
    traffic_light_plot = Visuals.TrafficLightPlot(
        Id("Traffic light plot"),
        data_id
    )
Add to Postprocessing
Adds traffic light plot visual in postprocessing to control_container, using the specified relative positioning.
    control_container.add_control (
        traffic_light_plot,
        True,
        RELATIVE_POSITIONING,
        0., 0., 1., 1./2.
    )