


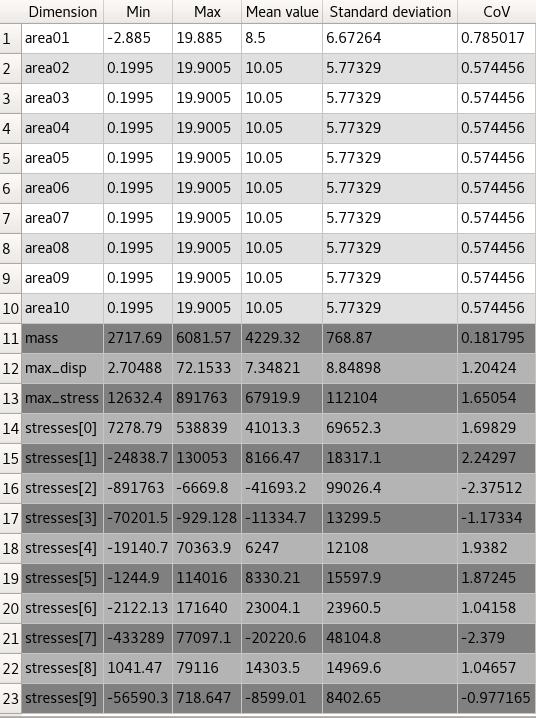
Shows statistical values of input and output parameters as well as criteria defined in the data set in a tabular view.
Preferences
The following preference settings are available:
Window appearance
For more details, see Plot Preference Settings.
Python Scripting
Create Visual
Creates a Statistic Values table using data with data_id.
    stats = Visuals.StatisticValues(
        Id("Statistic Values"),
        data_id
    )
Add to Postprocessing
Adds Statistic Values table in postprocessing to control_container, using the specified relative positioning.
    control_container.add_control (
        stats,
        True,
        RELATIVE_POSITIONING,
        0, 0, 1/2., 70/100.
    )