


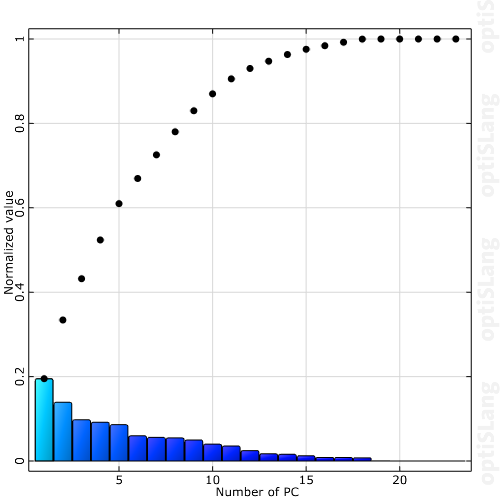
This plot shows the eigenvalues of the PCA problem normalized to the greatest value. The first value corresponds to the dominating parameter component (input and output) group. The bar chart plot shows the weights of the different parameter groups. By these normalized eigenvalues, it is possible to choose the PCA eigenvector for the PCA data window.
Preferences
The following preference settings are available:
Appearance
Font size
Line width
Symbol size
Enable axes
Enable surfaces
Axis Ranges
Labels
Palette
Window appearance
For more details, see Plot Preference Settings.
Python Scripting
Create Visual
Creates the visual using data with data_id.
    wpcv = Visuals.WeightedPCValues(
        Id("Weighted principal component values"),
        data_id
    )
Add to Postprocessing
Adds the visual in postprocessing to control_container, using the specified relative positioning.
    control_container.add_control (
        wpcv,
        True,
        RELATIVE_POSITIONING,
        0., 0., 1., 1./2.
    )