


This plot contains two different modes that you can select from in the Common settings pane.
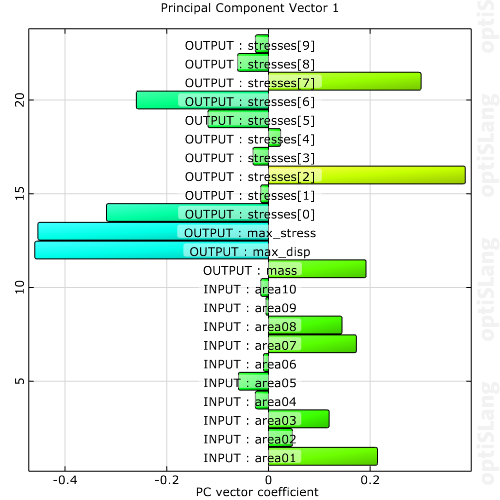
Eigenvector: Displays a bar chart plot with the current eigenvector of the Principal Component Analysis (PCA).
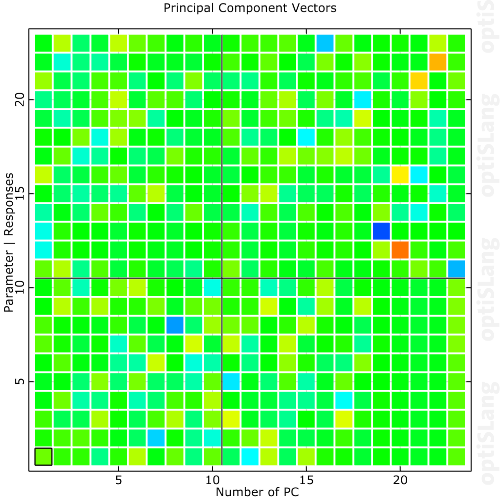
Load matrix: Displays a matrix grid plot with every column containing the values of one eigenvector of the PCA analysis.
Preferences
The following preference settings are available:
Appearance
Font size
Line width
Enable axes
Axis Ranges
Labels
Palette
For more details, see Plot Preference Settings.
Python Scripting
Create Visual
Creates a PCA data plot using data with data_id.
pca = Visuals.PCAData(Id("PCA Data"), data_id)
Add to Postprocessing
Adds PCA data plot in postprocessing to control_container, using the specified relative positioning.
    control_container.add_control (
        pca,
        True,
        RELATIVE_POSITIONING,
        0, 0, 1/2., 70/100.
    )