


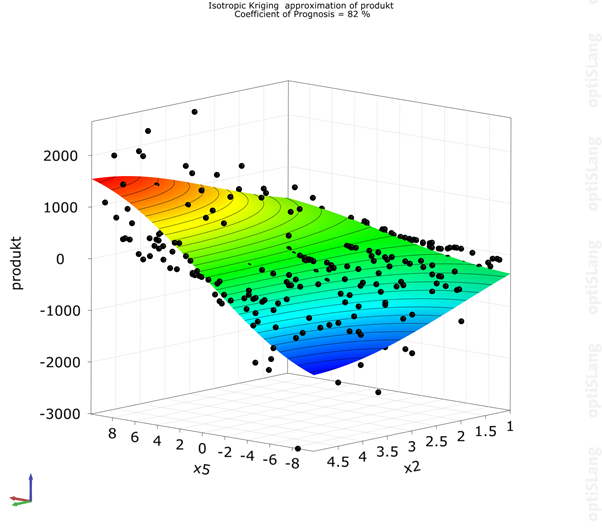
This plot shows the approximated values for the selected response or objective data function using both selected input parameters. If there are more than two input parameters used in the selected model, the remaining input parameter values for calculating the approximation surface are defined by the sliders in the Parameter Values section of the common settings. You can also shift the visualized subspace to a selected support point using the support point layer context menu options. If there are active designs not used as support points in the selected model, they are shown as additional designs in an extra layer here.
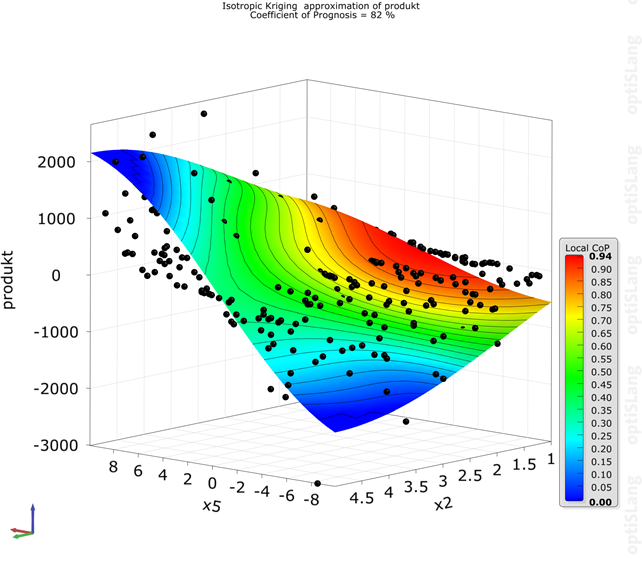
You can also display some local values like the CoP, approximation errors, or the support point density as color (palette data) on the approximated surface. For the local CoP or approximation error values, the respective values of the support points are interpolated.
Support Point Layer Context Menu Options
The following options are available on the support point layer context menu:
| Context Menu Option | Description |
|---|---|
| Deactivate | Deactivate selected designs |
| Activate all | Activate all designs |
| Use current design values | Shift visualized subspace to the selected design |
| Style | Change color and/or symbol of selected designs |
Settings
| Option | Description |
|---|---|
| Common Settings | |
| Resolution | Sets the resolution of the distribution of the approximated line. |
| Show additional designs | Shows or hides additional designs not processed by the MOP. |
| Preferences | |
|
The following preference settings are available:
For more details, see Plot Preference Settings. | |