


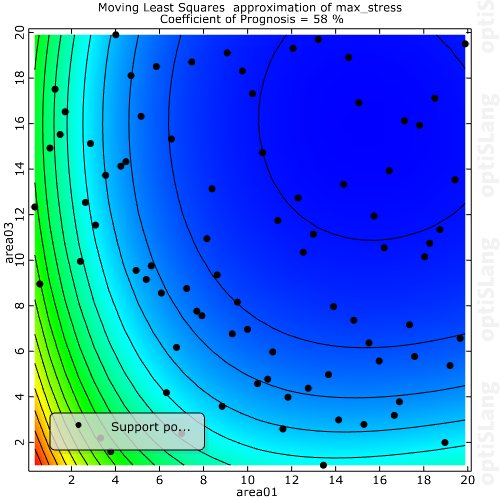
This plot shows a 2D colored topview of the approximated values for the selected response or objective data function with regard to the selected input parameter. In this plot again, it is possible to select a support point.
Support Point Layer Context Menu Options
The following options are available on the support point layer context menu:
| Context Menu Option | Description |
|---|---|
| Deactivate | Deactivate selected designs |
| Activate all | Activate all designs |
| Use current design values | Shift visualized subspace to the selected design |
| Style | Change color and/or symbol of selected designs |
Settings
| Option | Description |
|---|---|
| Common Settings | |
| Resolution | Sets the resolution of the distribution of the approximated line. |
| Show additional designs | Shows or hides additional designs not processed by the MOP. |
| Preferences | |
|
The following preference settings are available:
For more details, see Plot Preference Settings. | |